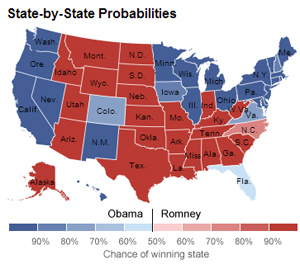
During Tuesday’s presidential election, one geek distinctly came to the forefront because he used “big data” to correctly predict all 50 states. His name is Nate Silver, and he’s so good with numbers he might be a witch.
Silver, formerly a successful baseball statistician, had his first big political win in 2008, with his blog FiveThirtyEight correctly predicting a landslide victory for President Obama, with a prediction of 349 electoral votes for Obama compared to his actual haul of 365. In 2008, Silver also predicted the popular vote split between Obama and McCain flawlessly.
[Editor’s note: VentureBeat will be discussing how this use by Silver of “big data” to refute the pundits is also one of the biggest trends impacting the wider economy, mainly in the enterprise, at our CloudBeat 2012 conference later this month.]
This year, FiveThirtyEight was picked up by the New York Times, and the scrutiny of Silver rose. His forecast also worked this time, showing that his proprietary model of averaging polls and weighing in additional factors like economic data wasn’t a fluke in the slightest. Silver had all 50 states marked correctly on his map, although Florida still hasn’t officially been called yet. (Obama is ahead there, however, with nearly 100 percent reporting.) FiveThirtyEight’s popular vote forecast (50.8 vs 48.3) looks quite close to the actual results (50.4 vs 48.1), which are 99 percent counted.
A few weeks before the election, Fast Company interviewed Silver in conjunction with the release of his book The Signal and the Noise: Why So Many Predictions Fail — But Some Don’t. Silver indicates that with so many polls and sources to dig data from, you have to pick ones with reliable history and weight them appropriately. It’s fair to say he interpreted polls predictively, and did not take each reading as gospel. He told Fast Company:
When human judgment and big data intersect there are some funny things that happen. On the one hand, we get access to more and more information that ought to help us make better decisions. On the other hand, the more information you have, the more selective you can be in which information you pick out to tell the narrative that might not be the true or accurate, or the one that helps your business, but the one that makes you feel good or that your friends agree with.
We see this in polls. After the conventions we’ve gone from having three polls a day to like 20. When you have 20, people get a lot angrier about things, because out of 20 polls you can find the three best Obama polls, or the three best Romney polls in any given day, and construct a narrative from that. But you’re really just kind of looking at the outlier when you should be looking at what the consensus of the information says.
Silver attracted disdain from bloggers on the right this election season, who said that the polls he was using to average and weight had been “skewed.” One of his most prominent critics, blogger Dean Chambers, admitted to Business Insider that Silver had it right.
“Nate Silver was right, and I was wrong,” Chambers said. “I think it was much more in the Democratic direction than most people predicted. But those assumptions — my assumptions — were wrong.”
Check out the videos below from The New York Times to hear Silver explain more about his methods:
Nate Silver screenshot via New York Times/YouTube
VentureBeat's mission is to be a digital town square for technical decision-makers to gain knowledge about transformative enterprise technology and transact. Learn More


