
Visualizing data from a single spreadsheet is like watching television. You can understand stuff. When you incorporate information from multiple sources, you can understand a lot more. It’s like seeing in 3D.
Cloud-based data visualization startup DataHero today introduced the capability to do just that in its premium version. You can take your Salesforce data, your Stripe data, your Dropbox data — whatever cloud-based data you like — and throw it at DataHero. It suggests the combinations that it believes is best or it lets you choose the data mashup.
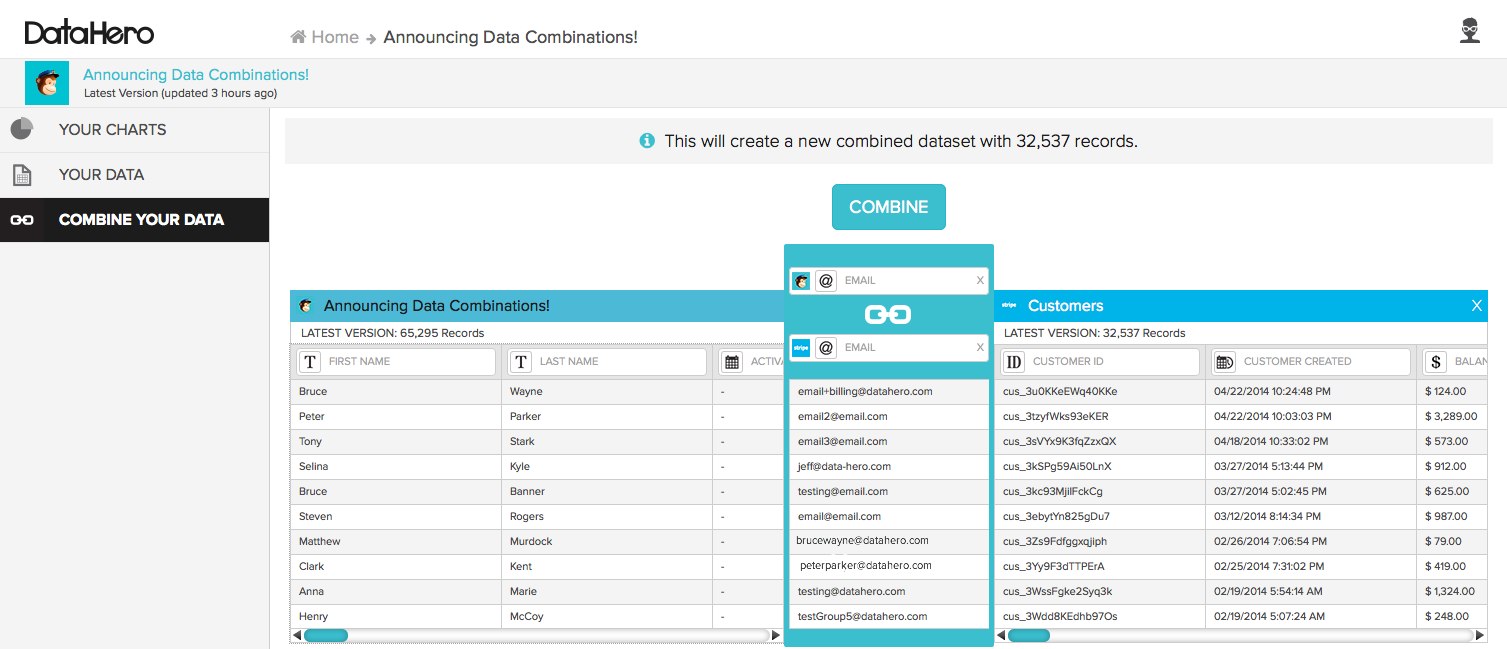
You check it out in preview mode to ensure the data is being integrated in the right way. Then you choose a style for visualizing your information. And bam, just like that, you’re a data wizard with a nifty graph that it can automatically update with fresh data on a regular basis.
A trend in big data these days is combining different types of data to get whole new ideas about your product, your company, and the world at large. Companies can put lots of data in repositories like data warehouses or even open-source Hadoop software, but then it isn’t always easy to access. DataHero believes in enabling anyone in a company analyze data. No wonder the startup talks about being aimed at “the 99 percent.”
DataHero had actually included the ability to visualize data from multiple sources in its initial alpha release, a couple of years ago. But then the startup stripped out the function, said chief executive and cofounder Chris Neumann. The problem: The feature wasn’t seeing enough use. It clearly wasn’t simple enough. He elaborated in an email today:
When we expanded our development and user testing post-investment, we quickly found that there was an enormous amount of iteration to be done on use cases involving just a single dataset, let alone two (so initially, it wasn’t so much that they didn’t understand how to work with two datasets as they didn’t understand how to work with just one!). After we felt comfortable with the UI/UX for interacting with one dataset (which was just over a year ago, when we released our public beta), we started working from the ground up on user interface paradigms for working with multiple datasets. That work and user testing has been ongoing for the past year, while we added new features, third-party integrations, and otherwise advanced the product in parallel.
Now their efforts have resulted in a wholly redesigned feature, one that appears more intuitive, and one that could help more people inside companies grasp what’s actually happening, not just work based on what they assume is happening.
Neumann will speak about empowering individuals at our DataBeat conference in San Francisco next week. Fewer than 50 tickets remain.
DataHero announced a $3.15 million venture round in December.