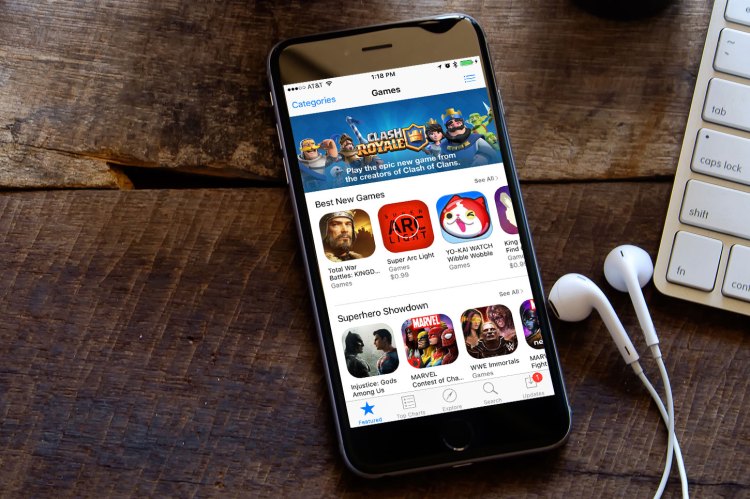
U.S. iPhone users spent an average of $35 on apps during 2015, according to research by Sensor Tower. Of that amount, $25, or 71 percent, was spent on games.
The research is based on 110 million iPhones that were in active use in the U.S. last year, according to Sensor Tower and data from Consumer Intelligence Research Partners. The surprising part is how much more was spent on games compared to the second-highest grossing category.
On average, games accounted for $25 per person, while music was second at $3.40 per person, or less than one sixth of games.
Social networking, entertainment, and lifestyle rounded out the top five categories, at $1.80, $1, and 40 cents spent, respectively. The remaining $6.80 was spent on the app store’s 18 other categories that generated revenue during the period studied. Of those, health and fitness grossed the most at 35 cents per device, while catalogs made the least at 1 cent. The figures are the net revenues that result for publishers after Apple’s 30 percent is taken out.
People downloaded 10.5 games per active iPhone, or more than two times the average number of apps for photo and video, the second-most-downloaded category with 3.4 per device.
Social networking was a close third with an average of 3.3 apps downloaded, while entertainment and lifestyle rounded out the top five with an average of 2.7 and 2.3 downloads per device, respectively. Of the remaining 18 categories with downloads during the period, music saw the most with 2.2 installs on average, while catalogs saw the least with 0.17 per device.
Sensor Tower estimates that each game install — an average of 10.5 per device — grosses an average of $2.43.
VentureBeat's mission is to be a digital town square for technical decision-makers to gain knowledge about transformative enterprise technology and transact. Learn More

