Last month I covered Virtualitics’ $7 million Series B and how VR and AR data visualization stands to fix some of our most pervasive big data challenges. The tech enables not only enterprises and organizations, but anyone, to use their spatial intelligence to spot patterns and make connections that breakthrough the tangled clutter of big data in a way that has been out of reach even with traditional 2D analytics.
In the case of Atomic Fund, the crypto investment fund wanted to explore a dataset of a recent Bitcoin market crash that took place on February 5th, 2018. So they queried the data from the blockchain.info API and uploaded a 10-minute slice onto 3Data, a leading immersive data visualization platform, in order to map it into an interactive microcosm of wallet transactions as you can view below.

Above: A volatile blockchain market visualized using 3Data
“We’re constantly exploring new ways to understand all the data available out there and we thought we could unlock some new insights by literally looking at the data differently,” said Piero Gancia, the head of operations at Atomic Fund. “And I don’t mean by trying some new analysis or new model, but just trying a different type of interaction with the data.”
Forewarned is forearmed
“From the transaction lists within the blocks, we set each unique wallet identifier as a node and found every combination of pairs of wallets which had transferred bitcoin between each other as an edge for our network graph,” said William Murphy, Senior Data Engineer at 3Data. “By examining the patterns of transactions that occurred during a market crash, we aimed to generate hypotheses about patterns that could be indicative of market trends when they appear in future transactions.”
It reminds me of the 1998 movie, Pi, where the protagonist, an obsessed number theorist, goes insane in the pursuit of a mathematical formula that would enable him to predict the stock market. Fortunately, platforms like 3Data will save countless data scientists from having to go through similar pains because it reframes the problem so that it is less about cracking codes like a genius and more about making use of our innate capacity for basic pattern recognition.
The blockchain’s public ledger, for instance, can be too much to handle for traditional methods and toolkits, but it plots nicely and neatly into 3Data’s visual smorgasbord, where user navigation is much less intimidating — see the image at the top of the article.
“The first step towards building any effective predictive model is to gain an understanding of the data through visualization. The Bitcoin blockchain in particular pushes the limits of traditional data visualization technology, as its support for transactions involving multiple payers and multiple payees and high transactional volume would create an incomprehensible jumble of overlapping points on any two-dimensional viewer,” Murphy said.
No more borders
Platforms like 3Data are becoming simpler and more intuitive to use, but also much easier to access, which is a boon for collaboration between teams with mixed backgrounds. For instance, 3Data’s online environment was developed from the ground up in WebVR, the JavaScript API that lets you load up VR and AR content with just your web browser.
WebVR is inherently cross-platform, so one team member can be playing with the spatial nodes or data points while immersed inside (wearing a VR headset) what 3Data is currently calling the “data dome” while another member, like an executive, supervises and coordinates in real-time on their smartphone or laptop, without ever needing to wear a headset. And WebVR’s forthcoming seismic-upgrade to the WebXR API will soon extend its support to also include AR devices.
In fact, their platform wasn’t designed to cater to just highly-trained data scientists, but for anyone with a stake in the game. In the not so distant future, I picture the average Joe or Jane regularly making use of their spatial intelligence to slice and dice big data of any kind, because everyone has the basic skill-sets required to play Sherlock Holmes in mixed reality. All they need to get started is access to big data sets, which I also foresee as being more prevalent not too long from now.
No longer esoteric
“Essentially, the jump from 2D to 3D is not linear but exponential from a visualization standpoint. Another advantage is reducing the need for a priori knowledge,” said Travis Bennett, the director of R&D at Kineviz, another company in the space. “We’re enabling users to spot patterns in data sets they have no familiarity with, or even necessarily domain expertise.”
Pattern recognition is an inherent talent that we all possess; the evolutionary edge that sets us apart from the animal kingdom. So, it’s not so much that immersive data visualization unlocks big data but, rather, that it allows us to interact with big data in a way that is natural for us. It altogether changes our position, and therefore our relationship, to it. In other words, it reveals the not-so-obvious truth that the reason that 2D analytics and traditional data analysis are so tedious and require experts in the first place is because the methods and tools have been, for a lack of better word, primitive. Emerging tech, on the other hand, tends to change the playing fields, and in our favor.

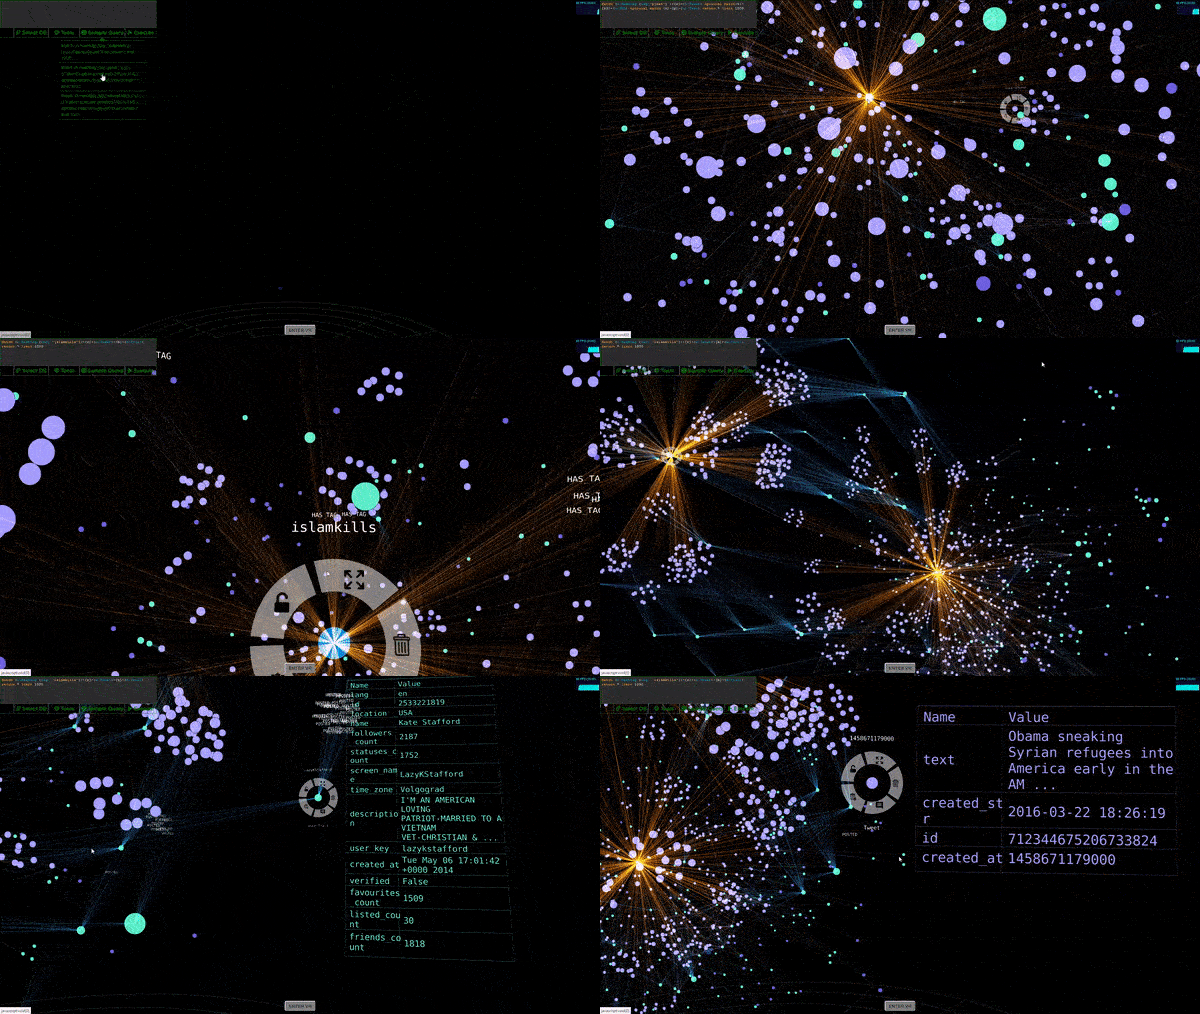
Above: Kineviz’s GraphXR platform tasked to explore Russian troll data
The above illustration, for example, shows Kineviz’s GraphXR platform being used to explore Russian troll data that was recently published by NBC News of over 200,000 tweets using the graph database, Neo4j. In this case, any ordinary person can navigate through the tangled web of connections simply by having access to the data, which they can then work to make sense of by spotting the scattered and condensed visual clues and following their trails as if it were a puzzle game. Imagine crowdsourcing analysis of big data to the public and you’ll see where I’m going with this.
Enter the dragon
“Movement exposes relationships between data points—rather than keeping mental track of node movement from one plot to another, users can see the relationships in three dimensions. Furthermore, the ability to integrate rich, unstructured data—video, images, documents, and 3D models—into an abstract data visualization means users are able to experience their data in a way that reflects how we experience the real world.” Travis told me.
We have reached a point in time where much of the vast digital landscape of data can be now rendered into visual expressions that, paired up with artificial intelligence, can be readily deciphered and understood by anyone with simply the interest to mine big data. And all this because the underlying tech has become advanced enough to finally align with how we visually process the world.
Amir Bozorgzadeh is cofounder and CEO at Virtuleap, the host of the Global WebXR Hackathon and the startup powering up the Gaze-At-Ratio (GAR) XR metric.


