
Suhail Doshi is the cofounder and CEO of Mixpanel, Inc.
Even the best games eventually fall out of style. Some newcomer will always arrive to bump out the current top download. The ebbs and flows of the market are hard to predict: New control styles, game formats, even themes and characters can create the new “must have” game. This is all well and good for game players, but for some game developers it can seem like the fate of their games is out of their hands.
Data may not be able to help games avoid the inevitable fizzle, but it can certainly help us figure out when this fall might occur. Armed with this information, perhaps game developers can help their work cheat death—or at the very least know when a game’s popularity might begin to wane. Such knowledge can help companies optimize development cycles so they always have something new and awesome on the horizon.
On that note, let’s take it to the charts.
A steep fall for most games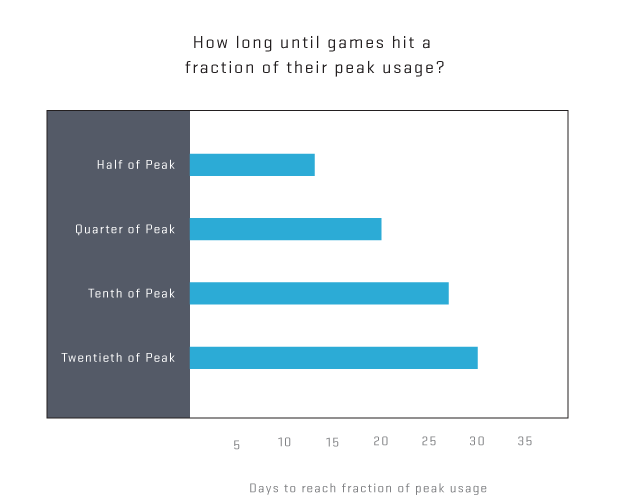
We took a look at millions of data points across almost 200 different games and found some interesting trends. We first identified the day of peak use for each game, measured by volume in data points. This isn’t exactly the day where the most people played the game, but it’s a good proxy and helps us define our “zero point” after which the game’s popularity begins to fade. We measured the time for at least 80 percent of games to drop to drop to certain fractions of usage from this zero point. Use falls 50 percent about 14 days after this zero point, and 6 days later (20 days after peak) use drops 75 percent. For this same group, around the 25-day mark things begin to accelerate: At 27 days usage drops to around 10 percent of the original peak, and by 30 days—about a month later—usage plummets to 5 percent.
The chart is compelling: Once a game begins to “fizzle out”, use will decrease 95 percent inside of one month for the vast majority of games. Changes in public opinion are swift and fierce, giving game developers very little time to try to reverse the trend. Remember that this is the bar for 80 percent of games to cross this threshold; most games fizzle out more quickly, and fewer than one in five perform better. The message here seems quite bleak, but a different reality emerges when games are bucketed according to their peak popularity.
All that fizzles is not dead

Though all games will eventually fizzle, the way in which a given game’s use decreases depends on its popularity. We split games out into three groups based on their shape of the distinctive shark fin plots. The “best” games (those rarities in the top group of peak usage) typically decline much slower than typical games. This cohort remains at 45 percent of peak use by week 15, and although weeks 17-21 show a slight dip these games flatten out to around 45 percent peak use by week 32. This clearly illustrates that the most popular games stick around for a while. Developers of extremely popular games can expect the fizzling process to take much longer than those with lower peak traffic levels—and it’s altogether possible that most of these games retain players for a long time, even after they peak.
“Good” games (those in the middle cohort), on the other hand, fizzle out much more quickly: by week 15 most have traffic around 20 percent of peak, with use just below 10 percent by the end of the month. This, while still better than the baseline, is still 30 percent worse than the “best” games. This cohort is closest to the average, and it makes sense that most of the games we surveyed fall into this category. The decrease from week 20 to 30 is quite flat (greater than 5 percent in those 10 weeks)—it seems that even after these games wane in popularity, some diehard players keep at it.
The bottom cohort of games (what we refer to as the “typical” cohort) have the steepest fizzle curve. By week 15 these games are already at around 10 percent of their peak traffic, and by week 30 traffic is in the mid single digits. Unlike the “best” and “good” games, “typical” games do not flatten out by the end of the period; rather, the downward trend continues with a limit closer to zero. This cohort is likely composed of fad-driven games, which are unlikely to retain a high portion of players as popularity begins to wane. Developers of games in this cohort are the most exposed to “fizzle risk”, and should take care to maintain release cycles that always keep a new game on deck.
Game developers who understand these shark-fin plots can benefit greatly—especially if they track performance and compare it to these benchmarks. Once a game begins to build up towards a peak the race to solidify a strong, monetized player base does not last long. The need to identify your most valuable players with detailed data is clear – setting up robust analytics after the peak is probably too late.
While every game’s popularity will eventually “fizzle,” the impact this will have on the game’s revenue differs dramatically between the most and least popular apps. Knowing which cohort your game falls into can help mitigate some of the risk—or at least allow developers to predict when it might be time to throw their weight behind a new release.
 Suhail Doshi is the co-founder and CEO of Mixpanel, an advanced analytics platform for mobile and the Web. More than 1,800 mobile apps and websites use Mixpanel to analyze more than 17 billion actions every month. Follow him @suhail.
VentureBeat's mission is to be a digital town square for technical decision-makers to gain knowledge about transformative enterprise technology and transact. Learn More