For a startup, a lot is riding on the home page. You might be surprised, then, to learn that startups vary wildly in how quickly and reliably their website home pages load.
[aditude-amp id="flyingcarpet" targeting='{"env":"staging","page_type":"article","post_id":391758,"post_type":"story","post_chan":"none","tags":null,"ai":false,"category":"none","all_categories":"business,mobile,","session":"D"}']That’s especially true when you look at load times on mobile devices. An increasing number of people use smartphones and tablets to browse the web, and yet — for some reason — the mobile versions of many startups’ sites lag far behind their desktop equivalents.
Keynote Systems‘ new Startup Shootout Index provides some insight into the three-screen challenge now facing anyone with a web presence. It’s the first website performance index to measure load times and completion percentages on desktops, smartphones, and tablets simultaneously.
AI Weekly
The must-read newsletter for AI and Big Data industry written by Khari Johnson, Kyle Wiggers, and Seth Colaner.
Included with VentureBeat Insider and VentureBeat VIP memberships.
If a home page doesn’t load quickly and reliably, it risks driving away valuable new customers. If you’re lucky enough to get someone visiting your site, you don’t want them disappearing before you’ve had a chance to make your pitch.
To do the test, Keynote used its network of PCs to simulate desktop web traffic to selected startup websites from a variety of locations around the U.S. Additionally, Keynote simulated traffic from iPhone 4 and iPad 2 users in four locations: Chicago, Dallas, New York, and San Francisco. (We’re using Apple’s mobile devices as proxies for all mobile gear, which is not a complete representation of the mobile universe, obviously, but it does represent a wide swath of mobile users.) Tests were done over a period of weeks and the results averaged into scores for each website. In addition, Keynote created an index score for each category, which represents the average of all the websites in that category.
Note that the test measures home page response times, not the time to complete a transaction or do other activities on these sites.
The 34 startup websites measured by Keynote are grouped into six categories: Collaboration (including sites like Box, Dropbox, and Huddle), Travel, Mobile and Social Gaming, Social Retail (Gilt Groupe, Fab.com, and the like), Social Networking, Digital Entertainment (Spotify, Rdio, and Turntable.fm). To view this month’s full data set, check out the spreadsheet embedded below.
VentureBeat is proud to be Keynote’s exclusive media partner for this index, which means we’ll be publishing the results every month. We’ll focus on a different segment of the index each month. And yes, we know that those who live in glass houses should not throw stones, which is why we’ve asked Keynote to measure VentureBeat’s website performance as well, and we’ll report that data as soon as we have it. We’ll keep lobbing those stones, but at least you’ll know that we’re smashing our own windows, too.
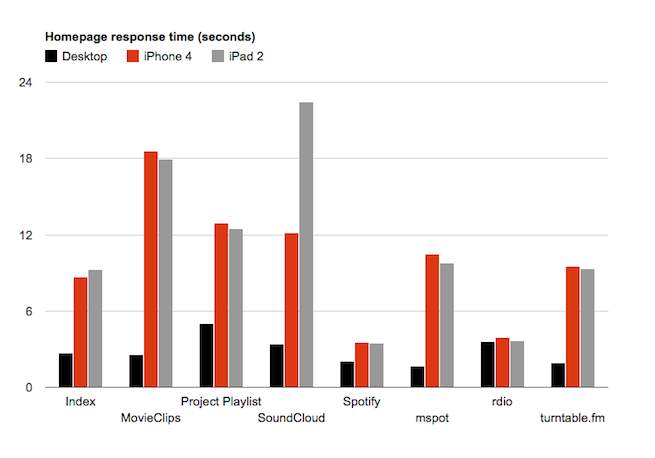
This month, we’ll zero in on digital entertainment startups, whose response times are shown in the graph above.
[aditude-amp id="medium1" targeting='{"env":"staging","page_type":"article","post_id":391758,"post_type":"story","post_chan":"none","tags":null,"ai":false,"category":"none","all_categories":"business,mobile,","session":"D"}']
Spotify has been in the news a lot lately, thanks to its arrival in the U.S. and its recent partnership with Facebook. The company has done a good job of keeping its performance consistent between desktop, smartphone, and tablet versions of its site, as has Rdio.
However, other sites don’t show the same consistency. Facebook has the top-ranking response time for its desktop and smartphone websites, but its tablet site ranks fifth overall.
“We’re seeing that tablets are often a distant third when it comes to performance,” said Tim Murphy, senior mobile marketing manager at Keynote Systems. On Facebook’s performance, Murphy noted that the site’s iPad response time is nearly eight times slower than the desktop on the same 3G network. “The iPad is 2X slower than the iPhone largely because they’re sending about 265KB of data to the tablet user versus 142KB to the smartphone user,” Murphy added.
As for the other categories, Murphy noted that mobile and social gaming sites seem to lag behind the rest of the startup categories. But retail sites need to improve too. “Retailers need to pay more attention to the mobile web, to meet the needs of the growing number of mobile retail consumers,” Murphy said, citing recent data from eMarketer on the growing number of mobile consumers.
[aditude-amp id="medium2" targeting='{"env":"staging","page_type":"article","post_id":391758,"post_type":"story","post_chan":"none","tags":null,"ai":false,"category":"none","all_categories":"business,mobile,","session":"D"}']
You can see the full set of this month’s Startup Shootout Index data in a Google spreadsheet, or view it in the embedded spreadsheet below.
VentureBeat's mission is to be a digital town square for technical decision-makers to gain knowledge about transformative enterprise technology and transact. Learn More

