Mobile is big and getting bigger, with mobile Internet revenue forecast to hit $850 billion by 2018. Yet well respected VCs like Marc Andreessen and Bill Gurley have debated the merits of billion dollar valuations across mobile — and tech more broadly. Digi-Capital’s new mobile deal analysis shows investments and exits trending in different directions, with mobile valuations splitting across sectors.
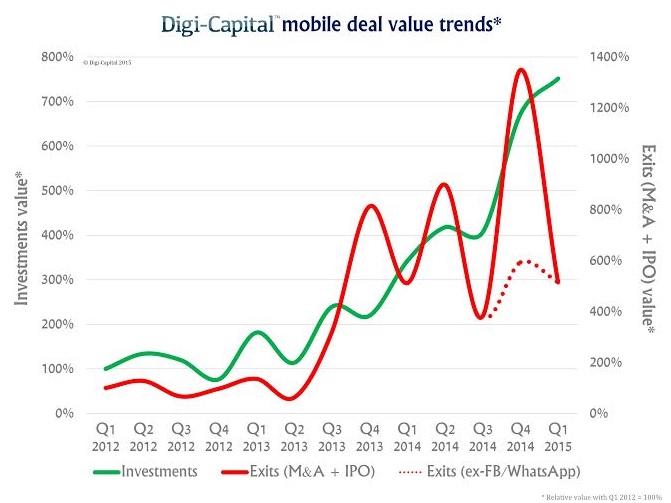
Mobile investment is growing as quickly as mobile usage and revenue, with $14 billion invested in Q1 2015, up 120 percent compared to Q1 2014 (650 percent higher than Q1 2012). That’s a bull market in anybody’s terms.
While the mobile exit market (M&As and IPOs) outpaced investment market growth up to Q2 2014, it has been trending downwards since the mobile IPO fiesta of Q3 2013 to Q2 2014. That downward trajectory is easier to see when the massive Facebook/WhatsApp deal is taken out of the mix as an outlier. So while $15 billion of mobile exits in Q1 2015 was pretty solid, it was only $1 billion higher than investments in the same quarter. If this happened in just a single quarter, there wouldn’t be much of a trend, but things have been heading in that direction (with significant variance) since the start of 2014.
Folks tend to look for a single unifying rationale for this sort of thing. Some will tell you there is a mismatch between optimism and conservatism between VCs, corporate acquirers, and public market investors. Others talk about asset holding times for different investment classes giving different growth perspectives. But life in mobile isn’t as simple as that.
It’s complicated
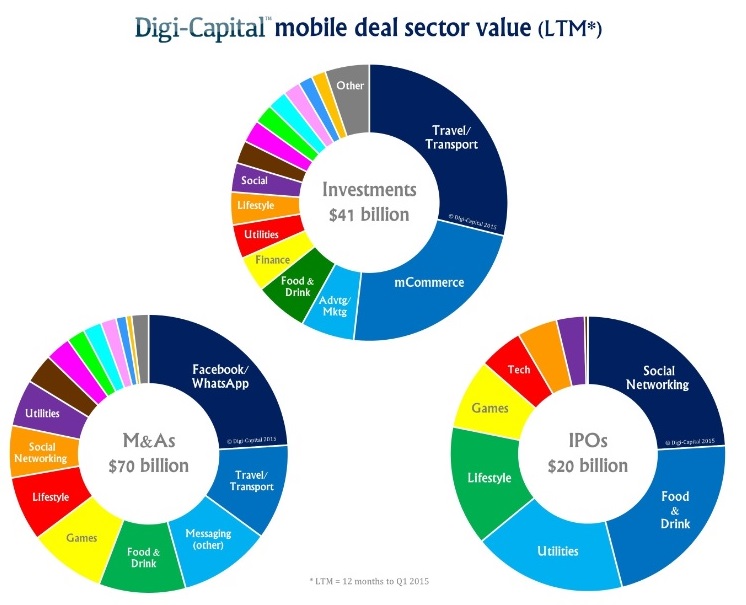
Mobile Internet isn’t really a single market. There are 27 sub-sectors, each with their own dynamics, and it’s important to dig below the top level numbers.
The $41 billion of mobile investments in the 12 months to Q1 2015 was dominated by travel/transport (e.g. Uber, Lyft) and mCommerce (e.g. Flipkart, Wanda eCommerce), which together took over half of mobile investments. Advertising/marketing, food and drink, finance, utilities, lifestyle, social, tech, and wearables each raised over $1 billion, with 13 others sectors taking over $100 million individually.
The $70 billion of M&As in the 12 months to Q1 2015 were more concentrated. Messaging dominated (equal in first place with travel/transport even without Facebook/WhatsApp). Games, food and drink, lifestyle, social, and utilities all topped $5 billion. Seven other sectors delivered over $500 million, with six more over $100 million individually.
The recent IPO slowdown hit mobile as much as any other market, with $20 billion of IPOs in the 12 months to Q1 2015 across only nine sectors, led by social, food and drink, utilities, lifestyle, games, and tech.
A game of two halves
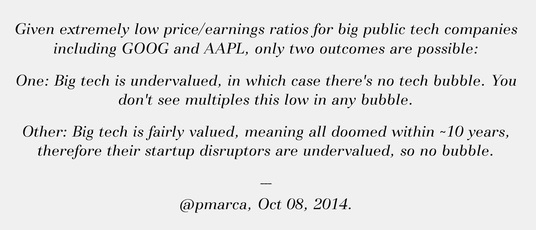
It would be fair to say there are different opinions on tech valuations. Andreessen articulated an elegant “no bubble” argument last year, reinforced by Shopify’s recent IPO:
Yet Gurley was reported at SXSW in March to have said that “a complete absence of fear” in Silicon Valley had led venture capital firms to take big risks on tech companies, and that those companies could face a turn in the market in the near future including “some dead unicorns this year.”
So with 79 mobile Unicorns worth over $575 billion in Q1 2015, the valuation question has a lot riding on it.
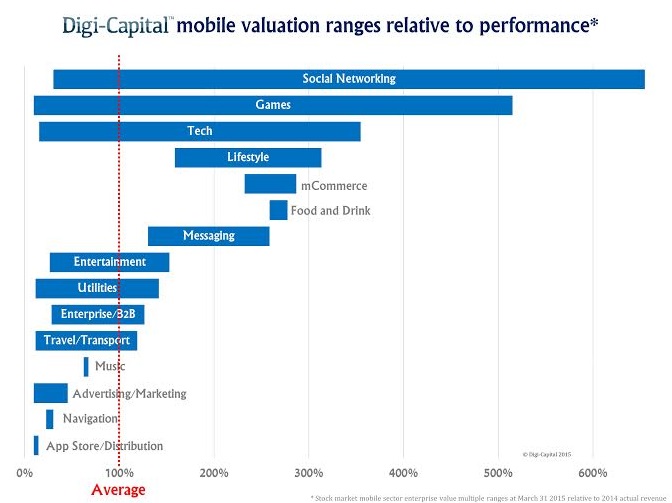
Even sectors with high valuation ranges have a lot of companies with average valuations. So while the big guys drive the top end and the discussion, the key is to look at them in context.
Looking at public company valuations first, around half of the mobile sectors have valuation ranges that are tightly grouped relative to performance without many outliers. The valuation dynamics in these sectors don’t look very different to other tech markets. The other half of mobile sectors have valuation ranges that soar significantly above average (some by over 600 percent). So while many companies in these sectors have similar relative valuations, others are valued up to 6x higher with the same sector economics.
Mobile public stock market sectors with high relative valuation ranges include social, games, tech, lifestyle, mCommerce, food and drink, and messaging. Within those, social, games, and tech also have companies below average, so broad valuation ranges. Mobile stock market sectors clustered closely above and below average include entertainment, utilities, enterprise/B2B, and travel/transport. Mobile stock market sectors with relatively low valuation ranges include music, advertising/marketing, navigation, and app store/distribution.
The situation is similar when analyzing private company valuations, although some of the outliers have become more extreme. While many sector valuations are grouped around the average, others have valuations up to 900 percent higher on a relative basis. That’s 9x the valuation with similar underlying economic performance. It’s worth noting that some of the private sectors with higher valuation ranges are different to those in public markets, again highlighting mobile’s complexity.
Mobile private market sectors with high relative valuation ranges include travel/transport, tech, mCommerce, advertising/marketing, and games. These private market sectors also have valuations below average, so again broad valuation ranges. Mobile private market sectors with relatively low valuation ranges include messaging (excluding the Facebook/WhatsApp acquisition), utilities, social, finance, photo and video, enterprise/B2B, and entertainment.
So with normalized valuation dynamics in half of the mobile market and the other half appearing a bit frothy, both Andreessen and Gurley are right.
The full analysis is here.
Tim Merel (@DigiCapitalist) is managing director of San Francisco mobile Internet advisor Digi-Capital.


