Android remains the top ad revenue-generating mobile platform after moving into first place only last quarter, but Apple is still the champ in monetization potential.
So says the new Q2 report from mobile ad platform Opera Mediaworks on the State of Mobile Advertising, out today.
In other words: Android makes more ad money, but iOS generates 2.2 times its share of ad impressions in revenue. That is, more money per ad impression, helped in large part by the iPad and its large number of lucrative video ads. Tablets in general show a much greater video ad traffic and revenue share than smartphones.
Check out VB’s research Mobile marketing automation: How the most successful apps drive massive engagement and monetization
$499 on VB Insight, or free with your martech subscription
And, in fact, the gap between Android’s share of revenue — 47.7 percent — and iOS’s (47.2) is only about half a percentage point, while Android took 63.7 percent of ad impressions for the quarter, compared to iOS’s 21.7 percent.
Other findings:
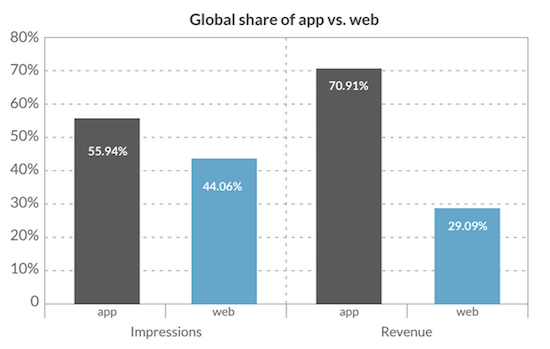
- Apps still represent most traffic (56 percent) and most revenue (71 percent), although traffic volume for the mobile web continues to increase. The report points out this is due to the worldwide growth in the mobile web.
- Gaming apps offer the highest eCPMs, or “effective cost per thousand impressions,” because of the “relatively high number of performance[-based], cost-per-installation campaigns,” mostly in video.
- One of the big surprises, Opera VP of communications Falguni Bhuta told me, is Sports, which had been in eighth place last quarter for ad impressions served, and is now in second place, right behind Social Networking. Bhuta explained this was because the National Hockey League and National Basketball Association championships coincided with the opening of the American baseball season.
- Meanwhile, the Communication Services category dropped from third to ninth in traffic volume and fifth to tenth in revenue generation.
- Not surprisingly, Social Media is the first “app of the day” category for most users, Entertainment apps rule the evening hours, and the use of Sports apps peaks in the morning.
- Social apps and sites maintain their lead for traffic and revenue, with nearly a third of all ad impressions and slightly more than 17 percent of revenue. The top five sources of ad revenue for publishers were News and Information, Games, Music, Video, and Media.
- News and Information is the app category with the most frequent/consistent use.
- The U.S. is still the leader in ad impressions served, followed in order by India, Indonesia, the Russian Federation, Mexico, South Africa, Brazil, the U.K., Canada, and Germany.
The data comes from the Opera Mediaworks ad platform, which claims 90 percent of the top Ad Age global advertisers, over 1.1 billion unique users, and more than 19,000 sites and apps.
VentureBeat's mission is to be a digital town square for technical decision-makers to gain knowledge about transformative enterprise technology and transact. Learn More


