 This sponsored post is produced by UPrinting.
As your business grows, you’ll find that gathering quantifiable data becomes even more important. But the ability to quickly come up with volumes of accurate data is pointless unless you understand what it actually means.
It’s funny that the field of statistics has come such a long way, and we’re much better equipped to collect and play around with data in ways previous generations only wish they could have.
Yet, interpreting statistical data, especially for fields like business, is not much easier than it was since the dawn of literacy itself. As in relationships between lovers, there’s always something you probably didn’t consider that could screw up your ideas on how you thought things were.
 In the early stages of WW2, the British had a problem. RAF aircraft were getting shot to pieces by German anti-aircraft guns. Bomber Command crews got it particularly bad – suffering an extremely high casualty rate: 55,573 killed out of a total of 125,000 aircrew – a death rate of 44.4%. A death toll almost as high as the combined American KIA and MIA count in the Vietnam War, which stands at 58,282.
And that was just the bomber crews. The Royal Air Force was losing aircrew and scarce material at all commands at absolutely horrific rates.
The solution seemed simple. Take note of the bullet holes on aircraft coming back from the field, and upgrade the armor in the spots that statistically got shot up the most.
“Brill!” as they say in British.
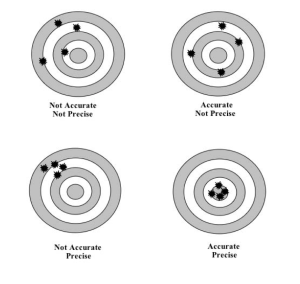
Unfortunately, it was the wrong solution. Abraham Wald, the founder of statistical sequential analysis pointed out the (truly) fatal flaw in the idea. Anti-aircraft fire at the time was accurate, but not precise – making bullet distribution pretty random.
 In other words – out in the field, aircraft were pretty much getting shot up uniformly throughout their airframes. The difference was, only the ones that were actually making it back home could be catalogued.
The real solution was to upgrade armor in the spots which statistically got the fewest bullet holes. After the upgrades were done, markedly fewer casualties were documented, and hundreds if not thousands of lives were undoubtedly saved.
These counter-intuitive solutions are often needed because even in a lab, it can be impossible to figure out all the things that can go wrong. There are even more imponderables in the field – and if timely decisions have to be made, this very fact has to be understood and accepted.
One of our customers once recounted a problem with response rates for a direct mail. He’d spent a lot of time figuring out his target market and designing his postcards and other print materials.
 But the response was absolutely abysmal. Almost no one replied to his offers. Most entrepreneurs would shrug this off as an error on their part. “Maybe I just suck at this!” they might think. Most of us don’t pay attention to (or totally despise) bulk mail after all.
Not this guy. He realized the response rates were much lower than reasonable projections. He actually drove around one of the targeted neighborhoods early morning on a hunch. Turns out the courier service employees were outright dumping unopened boxes of commercial mail on the curb – he figured the same thing happened to his postcards. After he had this problem rectified, he finally got response rates much better than he expected.
Statistical analysis and number-crunching will definitely figure more and more into your business as it expands. Probably not a great idea to dive in too deep if you’re just starting out, but it would be stupid to ignore it.
Data alone will never paint the whole picture. Understanding how it all comes together correctly is much more important than being able to gather survey results or play with numbers on Excel.
Entrepreneurs and small business owners will almost never have access to perfect data. I had to chuckle to myself writing this, because the idea is so ridiculous. However, understanding ways that data can be imperfect can make all the difference.
Photo Credits: doi.apa.net; science.howstuffworks.com; greyops.net
About the Author:
Art manages The Art of Small Business, UPrinting.com’s Small Business Blog. UPrinting is a leading online printing, marketing and technology firm offering a wide range of print products. Design brochures at UPrinting for free! Contact us for free print samples.
VentureBeat's mission is to be a digital town square for technical decision-makers to gain knowledge about transformative enterprise technology and transact. Learn More

