A new report out Wednesday suggests that venture capital investment returns — especially very short and very long ones — might not be as gloomy as some previous reports have suggested.That may be especially true for early-stage VC investments.
The National Venture Capital Association (NVCA) released numbers today showing that the last quarter of 2013 was another strong one for venture capital performance. Investments of almost all lengths studied showed larger returns than in the previous quarter, the report says.
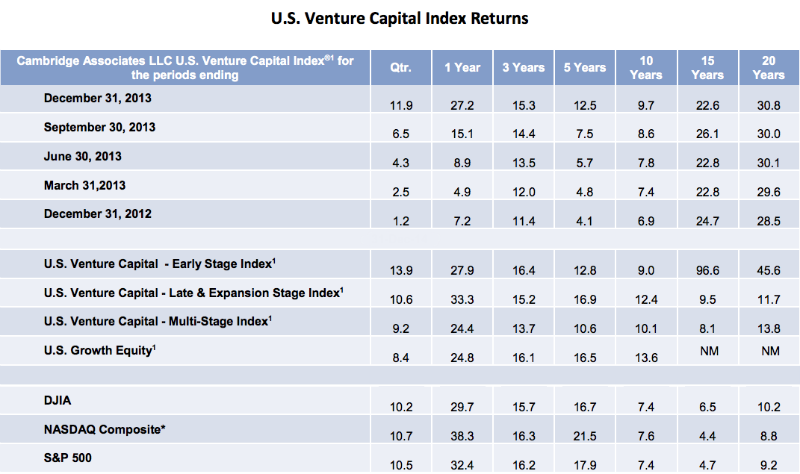
The performance of quarterly, one-year, three-year, five-year, and 10-year investments continued to improve through the end of 2013. Only 15-year investments saw return rates decrease from the previous quarter. Twenty-year investments stayed the same. (See chart below.)
The performance of quarterly, one-year, and five-year investments nearly doubled from the third quarter to the fourth quarter of 2013. By the end of the year, quarterly investments showed average returns of 11.9 percent, one-year investments showed 27.2 percent returns, and five-year investments had 12.5 percent returns, on average.
On the whole, venture capital investments outperformed the Dow Jones Industrial Average, the NASDAQ Composite, and the Standard and Poor 500 during the final quarter of 2013. Quarterly, 10-year, 15-year, and 20-year investments each brought in better returns, on average, while one-, three-, and five-year venture investments didn’t perform as well as the stock market composites.
The NVCA believes that the environment for profitable exits (like acquisitions or public stock offerings) has been good for the past few quarters (and is getting better) but that tech markets remain volatile.
“The recent pullback on tech equities and its dampening impact on the IPO market is a stark reminder of how volatile it can be,” said Cambridge Associates managing director of venture capital research Peter Mooradian in a statement. (Cambridge, the NVCA’s research partner, compiled the research.) “The question is whether this is a temporary pause or something more sustained,” he said.
Cambridge Associates maintains a database of financial information from venture capital firms and publishes reports on it quarterly. At the end of last year the database included 1,493 venture funds formed from 1981 through 2013.
Sources: Cambridge Associates LLC, Dow Jones Indices, Standard & Poor’s, and Thomson Reuters Datastream.
The Cambridge Associates LLC U.S. Venture Capital Index is an end-to-end calculation based on data compiled from 1,493 U.S. venture capital funds, including fully liquidated partnerships, formed between 1981 and 2013, and the U.S. Growth Equity Index is based on data compiled from 153 U.S. growth equity funds, including fully liquidated funds, formed between 1986 and 2013.
¹ Pooled end-to-end return, net of fees, expenses, and carried interest.
*Capital change only.
VentureBeat's mission is to be a digital town square for technical decision-makers to gain knowledge about transformative enterprise technology and transact. Learn More

