Google tricked out its entire I/O conference with hundreds of sensors this week. Today, we got a glimpse at some of the data and the work that went into making it happen.
[aditude-amp id="flyingcarpet" targeting='{"env":"staging","page_type":"article","post_id":739092,"post_type":"story","post_chan":"none","tags":null,"ai":false,"category":"none","all_categories":"big-data,cloud,","session":"A"}']Michael Manoochehri, with Google’s cloud engineering group, explained the project from Google’s perspective: It’s a big experiment designed to help Google figure out how to use its many cloud tools to collect, organize, and analyze large quantities of sensor-driven data.
Google I/O data sensors by the numbers
- 400: The number of sensor modules (aka “motes”) that have been plugged in around the conference center.
- 525: The number of sensor modules that Google built for this project. The team couldn’t find enough electrical outlets to plug all of them in, though.
- 3: The number of sensor modules that had been stolen after one day of the conference.
- 6: The minimum number sensors on board each mote.
- 20: The number of seconds between each packet of data sent by each mote.
- 50 million: The number of database records the project had generated as of yesterday afternoon.
- 150 million: The total number of database records the project will have generated by the end of Google I/O today.
- A few seconds: The amount of time it takes to run queries against this huge data store using Google BigQuery.
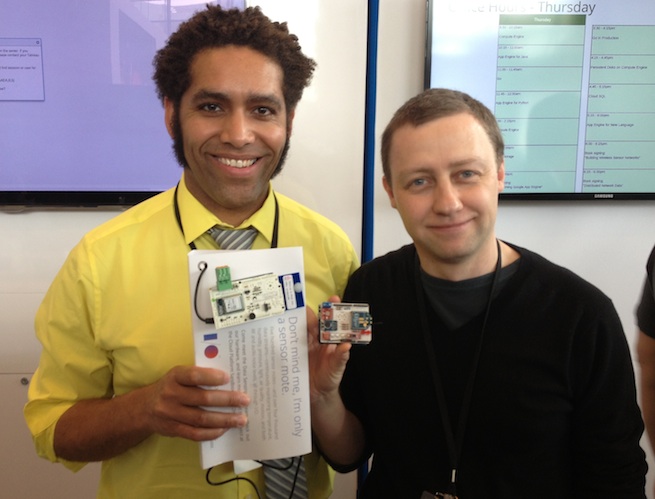
To pull off the project, Google needed some hardware-hacking experts. So it called on Kipp Bradford, a professor of engineering design and entrepreneurship at Brown University; and Alasdair Allan, a hardware hacker with Babilim Light Industries in the U.K.
AI Weekly
The must-read newsletter for AI and Big Data industry written by Khari Johnson, Kyle Wiggers, and Seth Colaner.
Included with VentureBeat Insider and VentureBeat VIP memberships.
The pair designed a sensor module based on the Arduino Leonardo R3 chip, a popular microprocessor that many DIY hobbyists use. Each module, or “mote,” carries a mix of temperature, humidity, noise, and other sensors. Some have air quality monitors that measure the amount of particulates (dust) and volatile gases (from cleaning fluids or alcoholic drinks). Some are connected to floor mats that record footsteps.
The devices send their data via a Zigbee-based mesh network back to Google Data Store, a NoSQL database running on Google’s App Engine. BigQuery, a tool for doing analysis on large datasets that is based on Google’s own internal data analysis tool, “Dremel,” allows the team to perform rapid queries on the enormous dataset (see sidebar for some of the project’s metrics). The team even used the Google Maps API to display data from each sensor on a map of the conference center.
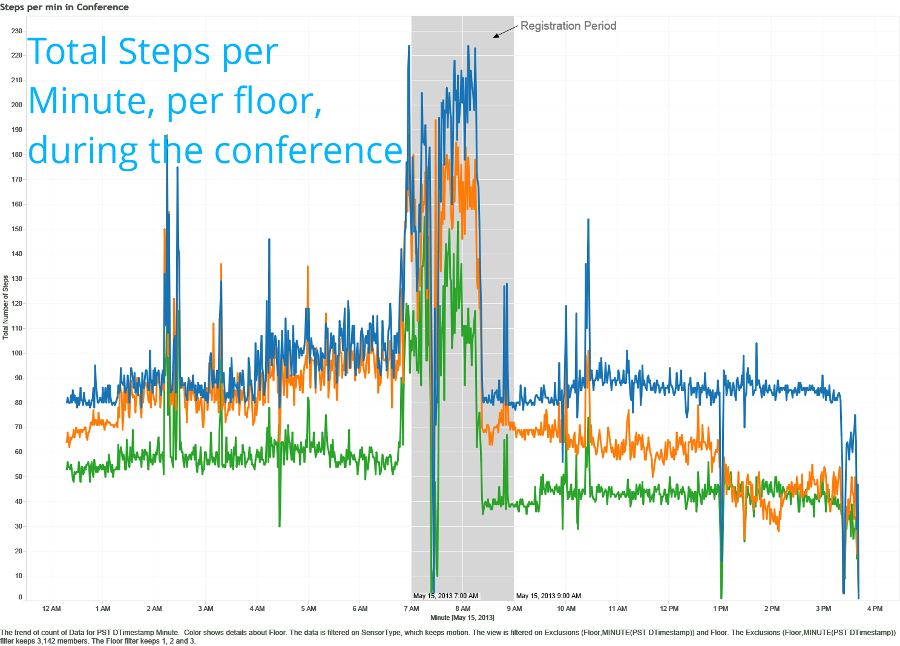
Tableau Software, which held an IPO this week and whose stock is already up 60 percent in its first day of trading, provided real-time visualizations of the data. That’s a Tableau-generated chart at the top.
Bradford and Allan are editors at Make magazine and have done similar work with O’Reilly’s Data Sensing Lab, albeit on a smaller scale. (O’Reilly is the publisher of Make and the organizer of the Maker Faire, coming up this weekend in San Mateo, Calif.) For O’Reilly’s Strata conferences, the Data Sensing Lab build networks of about 50 such devices.
Also helping Bradford and Allan were Julie Steele, a project manager for O’Reilly, and Harry Johnson, a Stanford engineering student who laid out the project’s first circuit board and acted as the project’s “sanity check,” Bradford said.
“When the first prototype came back and it worked, I breathed a huge sigh of relief,” Bradford told me.
[aditude-amp id="medium1" targeting='{"env":"staging","page_type":"article","post_id":739092,"post_type":"story","post_chan":"none","tags":null,"ai":false,"category":"none","all_categories":"big-data,cloud,","session":"A"}']
Once the team had built several working prototypes and ironed out the kinks, Bradford send the circuit board design to Sunstone, a company in Oregon, which produced hundreds of custom circuit boards. He then arranged to have the boards and various components sent to VR Industries, a company in Rhode Island, which assembled all 525 devices. The per-unit cost was about $120, though that’s with volume discounts figured in (it would cost you more than that to build one or two of these things).
After that, the team spent a nearly-sleepless week configuring and setting up all the devices.
For Google, it was a chance to get its hands dirty with real-world data.
[aditude-amp id="medium2" targeting='{"env":"staging","page_type":"article","post_id":739092,"post_type":"story","post_chan":"none","tags":null,"ai":false,"category":"none","all_categories":"big-data,cloud,","session":"A"}']
“We wanted to understand how this kind of use case could work with the Google Cloud platform,” Manoochehri said.
Did they learn anything about the conference? So far, the takeaways seem pretty obvious. For instance, in the steps-per-minute graph above, there’s a big spike of activity as people lined up to enter the Google I/O keynote on the first day. Then activity settles down as they all sit to watch the presentation. There’s a flurry of activity as people attend the first evening’s party, and the noise level spikes during Billy Idol’s concert. Air quality tends to go down when people are milling about, as they raise dust, and it gradually improves after they go away. Also, a cleaning crew comes through the Moscone Center at 4 a.m. every morning.
The company is making all the hardware, code, and data from the project available freely to the public. The goal is to make it easy for others to use the same kinds of technologies in their own data-gathering projects.
There are already lots of sensors out there. From wristband health and fitness sensors to smart thermostats like Nest to automobile sensors, we are increasingly surrounded by connected sensors. These devices are already collecting a lot of data, and soon will be collecting orders of magnitude more, Manoochehri said.
[aditude-amp id="medium3" targeting='{"env":"staging","page_type":"article","post_id":739092,"post_type":"story","post_chan":"none","tags":null,"ai":false,"category":"none","all_categories":"big-data,cloud,","session":"A"}']
“This is a really big deal,” Manoochehri said. “So we need to understand this use case, and test that our platform is good for this use case.
“People collect all this data, and they go, ‘Oh my god, what do I do?'”
This project provides an answer to that question — provided you’re willing to use Google’s many cloud services.
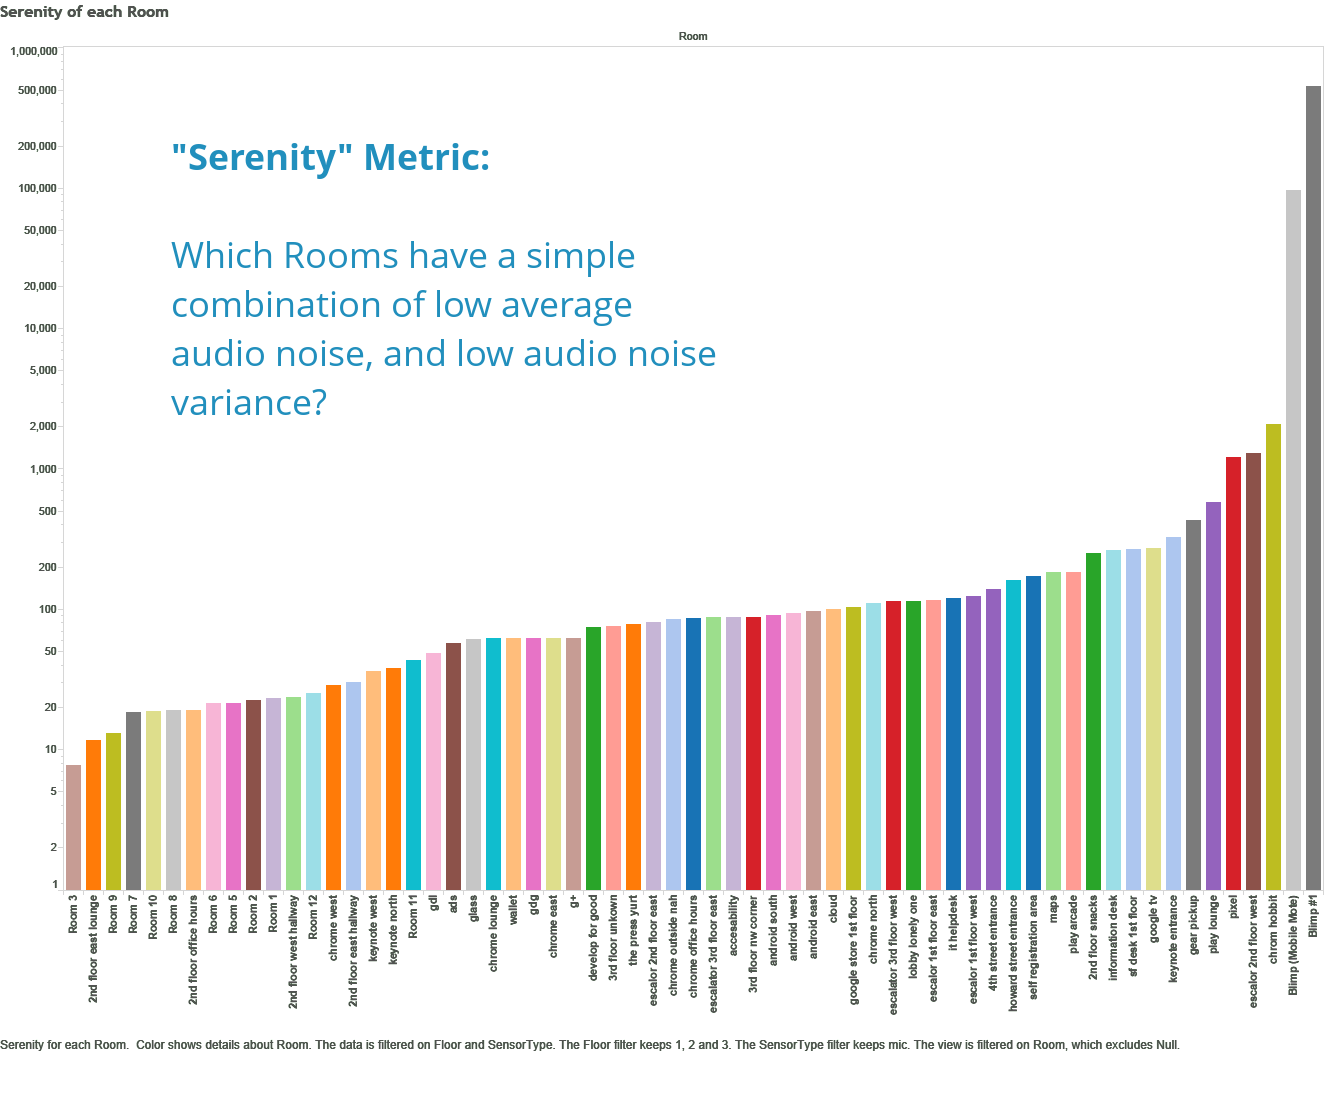
Also, if you are looking for the best place to take a nap, check the graph below, which shows Manoohchehri’s “serenity metric,” showing a combination of low average audio noise and low noise variance. Conference rooms in the far corners of the building are your best bet. The least serene location? Apart from Google’s radio-controlled blimps (which carried sensors over the crowd), the second floor escalator was the least serene location.
[aditude-amp id="medium4" targeting='{"env":"staging","page_type":"article","post_id":739092,"post_type":"story","post_chan":"none","tags":null,"ai":false,"category":"none","all_categories":"big-data,cloud,","session":"A"}']
VentureBeat's mission is to be a digital town square for technical decision-makers to gain knowledge about transformative enterprise technology and transact. Learn More