This post has not been edited by the GamesBeat staff. Opinions by GamesBeat community writers do not necessarily reflect those of the staff.
Editor's note: Jeff's article is pretty number heavy, but if a simpleton like myself could follow along, it's a safe bet that you can as well. By the way, this was post was written on January 22, before the game went on sale, and before review scores became available. Do we have the next great video game analyst right here in the Bitmob community? Only time will tell. – Aaron
Video games are not the only thing I care about. I love to absorb knowledge about economics, market analysis, history, and any number of things. I would love to write about games for a living, but my secondary dream career would be to have Michael Pachter's job.
I think I could do it, too. I have knowledge of the companies, consumers, and trends. I have an Internet full of data that I can mine for data, as well. My weapon of choice is Google Trends, a very interesting research tool that compiles all of Google's search data for analysis. It doesn't just give the number of searches, it compares the average number of searches of a keyword against any other keyword.
Many people decry Pachter as someone who guesses for a living and essentially that is all he does, but those guesses have a lot of education sprinkled on top. I thought I would take a look at some raw data and see if I couldn't come up with a "guess" of my own.
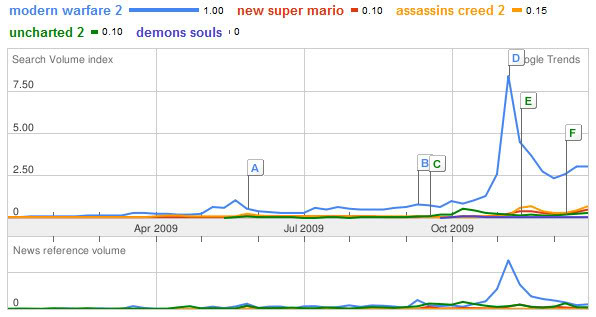
That brings us to the numbers by the rest of the search terms. You can see that there is a 0.10 by New Super Mario Bros. That is the ratio compared to Modern Warfare 2, so we can see by this that in 2009 New Super Mario was searched one time for every ten times that Modern Warfare 2 was searched. For me, it is easiest to look at Modern Warfare 2 — or in other charts whatever the first search term may be — as 100% and New Super Mario as 10%.
Now that we know how the charts work let's do some analysis. Modern Warfare 2 was the best selling game of last year, and was also the most searched game title. It has sold a total of 9.54 million copies to date, and was searched ten times as much as New Super Mario and Uncharted 2, and 7.5 times as much as Assassin's Creed 2. When compared to Modern Warfare 2 the game Demon's Souls doesn't even register for the year of 2009, which means the ratio is less than 0.01. For the sake of this analysis we will give Demon's Souls the 0.01 ratio. Here are the sales to date figures for each of the games that we have charted so far:
Modern Warfare 2 (PS3 and 360) — 9,543,000 — 1.00
New Super Mario Bros. — 4,907,000 — 0.10
Assassin's Creed 2 (PS3 and 360) — 2,995,000 — 0.15
Uncarted 2: Among Thieves — 1,322,00 — 0.10
Demon's Souls — 444,593 — 0.01
Before we go any further I should point out that I realize that the validity of sales numbers off of the Internet are always shaky. What is important, though; is I got all of the sales figures from the SAME site, and that they apply to North America just like the Google Trend numbers. With the information I've gathered, coupled with the knowledge we have of the console landscape, we can begin to analyze this information and come to some conclusions that will help us make predictions about the current crop of games.
First, we have to acknowledge that Modern Warfare 2 is a freak, but we also have to begin to expect at least one game a year to be "the yearly freaks." Halo 3 and the first Modern Warfare are a pair of freaks from 2007.
There are two games that have the same ratio. Both NSMB and Uncharted 2 have a .10 compared to MW2, but NSMB has sold nearly four times more than U2. We can account for most of that disparity if we take into account the gap in the install bases. There are about three times as many Wiis as there are PS3s. Three times 1.3M gets us to 3.9M, which is still a million short of NSMB. The rest of that gap can probably be explained by the "First-Party effect" on the Wii. The First-Party effect is the boost any Nintendo/Mario labeled game gets on a Nintendo console. Not only that, but NSMB didn't face competition from Assassin's Creed 2 and Modern Warfare 2 like U2 did. Some may consider it a stretch, but I think that we have neatly put NSMB and U2 right next to each other in terms of "relative sales."
That leads us to Assassin's Creed 2 and its 0.15 ratio. This is going to be different than NSMB and U2, because it is a multi-platform title.This will inflate the ratio and the sales numbers, but not exactly to the same degree. First, there will be more people who search for the game as a purchase because more people have the potential to play it. However, there's an overlap of users who own both a PS3 and an Xbox 360, so the total isn't a simple addition problem. If we add total 360s with total PS3s the sum (about 34M) is a little bit more than Wii (31M), then we have to compensate for multiple-console owners. This doesn't affect the Wii as much, because multi-platform games are rare on Wii. I'll say the total number of people with a PS3, Xbox 360, or both is around 24M (I have a method for coming up with this. If you want to know what it is just ask).
AC2 is a potential purchase to 24M gamers, but faced with the stiff competition of MW2 and other holiday games, we can see how the .15 turns into 2.99M copies sold. That is 2.26 times what U2 sold and the combined number of PS3 and 360 gamers is about 1.9 times just the PS3 install base; the extra .05 in the ratio easily makes up for the rest of the copies sold. I believe that I have shown some interesting numbers to support the idea that the Search Volume Index can predict excitement and eventual sales. I have yet to prove anything, but I think we at least have some concepts to work with.
The Future:
This is the first time I've looked nto this data, so this may not work, but here are some charts I gathered of games that have just been released or are about to be released. The first chart is a look at the past 12 months (from this day last year). The second chart is for the past 30 days. Each chart uses Mass Effect 2 as a base, and therefore the ratios in these charts should not be compared to the charts that had Modern Warfare 2 as a base.
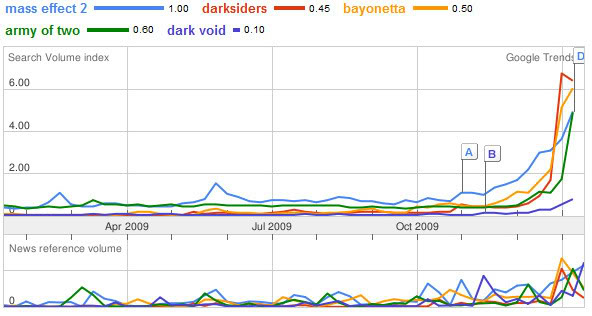
The lines are provocative. We can see that Darksiders has peaked higher than any other game so far, but it peaked after it was released. Mass Effect 2 yet to be released, and it's still on the rise.
Mass Effect 2 (360 only) — 1.00 — 2.75M
Bayonetta (PS3 and 360) — 0.50 — 800k
Darksiders (PS3 and 360) — 0.45 — 925k
Army of Two (PS3 and 360) — 0.60 — 1.6M
Dark Void (PS3 and 360) — 0.10 — 390k
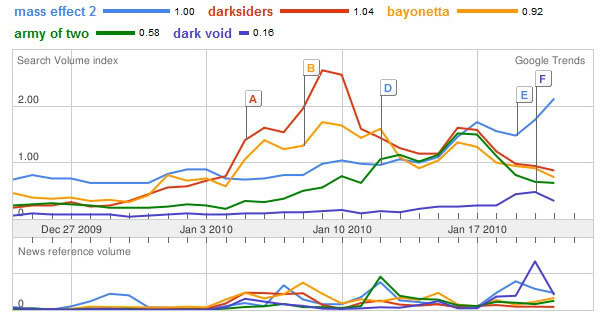
I'm going to skip a key step for how I began to come up with these number, because I want to keep some of my methods proprietary just in case I ever do get a chance at doing this for a living. However, I obviously need to explain why Darksiders has a lower ratio, but a higher forecast. Well, it doesn't really have a higher ratio. If you look at the 30-day chart you can see that Darksiders has been searched consistently more than Bayonetta. The 30-day ratio has Darksiders (1.04) even higher than Mass Effect 2 (1.00). I expect that to change now that Mass Effect 2 is out..
I came up the final number by comparing and contrasting to the earlier chart while making an amalgamation of the two new charts in my head. I know it sounds fishy, but I stand by these numbers. I think this is powerful information. Combine this data with review-score data and sequel data, and Pachter could start making predictions as sound as Vegas.