
This post has not been edited by the GamesBeat staff. Opinions by GamesBeat community writers do not necessarily reflect those of the staff.
Every year, the Entertainment Software Association (ESA) compiles a brief report on the state of the video game industry, including how much it’s growing, which games sold the most, and what the expanding audience of players looks like. Of all the findings in the 2013 “Essential Facts” report, the one that most outlets have focused on is the gender breakdown of the market’s current consumers.
Newspapers ranging from the Washington Times to the Indianapolis Star picked up the story that 45 percent of gamers are women. In response, sites like PC Magazine asked if gaming was “no longer a boy’s club,” and Think Progress wondered why there are still so few female characters in games. In light of these statistics, the lack of women on stage at Microsoft’s Electronic Entertainment Expo (E3) media briefing last month as well as the “rape joke” directed at a female Xbox Live community manager during the company’s Killer Instinct demo are drawing even more attention. If women make up nearly half of the video game market, why are companies like Activision, Electronic Arts, and Microsoft still catering almost exclusively to the adolescent male demographic?
The answer might be more complicated than the ESA lets on.
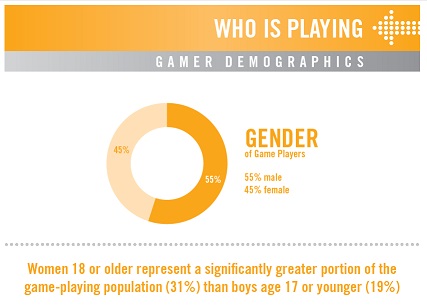
Above: A look at gamer demographics based on gender.
Take, for instance, the above chart. How exactly is the ESA defining “game players”? While it’s interesting that both men and women are almost just as likely to play a video game, the above statistics give us no insight into what they’re playing or how much. Of that 45 percent that are women, how many play video games on handhelds as opposed to consoles? How many play shooters or sports titles instead of massively multiplayer games or platformers?
Without some idea of what the breakdown is like within each gender group, knowing only that women enjoy games just as much as men doesn’t tell us much. Unfortunately, this problem persists throughout the ESA’s report. Categories like “computer and video games” and “game players” are never defined, which prevents the information from being effectively parsed and analyzed. In some cases, though, the report is just downright confusing.
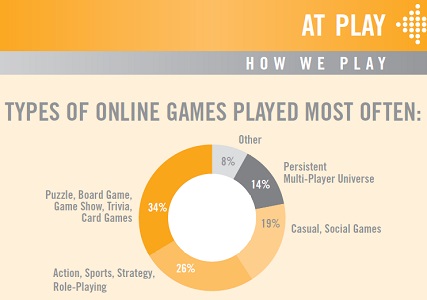
Above: A chart of popular online games.
Does “most often” mean overall — that of all the hours spent playing online games, these are the respective percentages spent with each genre? Or do the percentages refer to individual players, meaning that of all the people surveyed, 26 percent spent most of their time playing games of the “action, sports, strategy, role-playing” variety?
For instance, while fewer people overall might play MMOs, when compared to the number of people who play card or puzzle games, they would probably be more likely to spend a greater number of hours doing so than those engaged in a round of Scrabble while in the check-out line at the grocery store. What’s more, the categories themselves are unclear and, in many cases, nonsensical. Why would Madden be grouped with StarCraft? What does combining the people who play those titles, or the time they spend playing them, into a single group really tell us about player habits and preferences? And what even counts as a “casual” game? Wouldn’t it be more interesting to know how many people play a particular type of game (puzzle, action, sports) casually (spending only a few hours per week)?
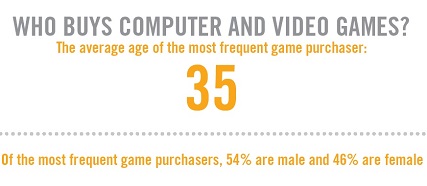
Above: The average age of the game player.
The ESA only introduces more confusion here by singling out “computer games” as something separate from regular “video games.” It not only raises the question of whether or not the ESA is including games played on computers in charts where they are not specifically called out but also makes one wonder whether the monolithic heading of “video games” includes mobile titles.
Also, how is the ESA defining “frequent game purchaser?” It would be much more helpful if the data were broken down into a series of ranges, like what percentage of people buy one game or fewer per month compared to those who buy two to three or even more.
To the degree that we want to get as accurate a picture of what the population of video game players looks like as possible, these questions are significant. Indeed, I hope that the gender breakdown of players really is as nearly symmetrical as the report suggests. It would also be reassuring to know that the market for video games and the kinds people want to play really is as diverse as some of the ESA’s “Essential Facts” make them appear to be.
Unfortunately, without clearer definitions or more rigorously explained and justified categories, the ESA’s 2013 report gives us a potentially misleading view of games and their players. The organization’s objective is to represent the industry, and doling out positive spin and good PR wherever possible is part of that. But the rest of us should be vigilant when presented with ambiguous and ill-defined data by an organization founded to champion the interests of video game corporations.
In the absence of better explanations of its data-gathering practices, the report is less a list of essential facts about players and more a series of pro-industry talking points.