Chief financial officers (CFOs) play a crucial role in their organizations, responsible for ensuring return on investment (ROI) in all investment areas, especially when it comes to IT. As a result, CFOs are expected to lead and influence the discussion about how the cloud can be used as a business enabler.
Due to the cloud’s pay-as-you-go nature, organizations are often at risk of suffering from cloud sprawl and in turn must monitor all costs closely so that overall budgets aren’t exceeded. Many finance teams run into numerous challenges while trying to create and sustain cloud cost transparency. Typically they want to take on these challenges with a proactive approach. With the right reports, they can recommend and even enforce IT efficiency, whether that means buying reserved capacity or supporting a decision to move between clouds.
Accurate cost allocation and chargeback and showback to different bodies in an organization are important methods of budgeting IT within an enterprise. However, one of the biggest challenges for CFOs is dealing with untagged cloud resources, which cause lack of clear segmentation between different departments, applications and projects. As a result, they need to track cloud cost thresholds for specific segments of their overall enterprise on a monthly or weekly basis.
The list below gives a nice snapshot of five cloud cost reports that help CFOs’ teams manage their responsibilities and overcome challenges by leveraging the public cloud.
1. Cost allocations
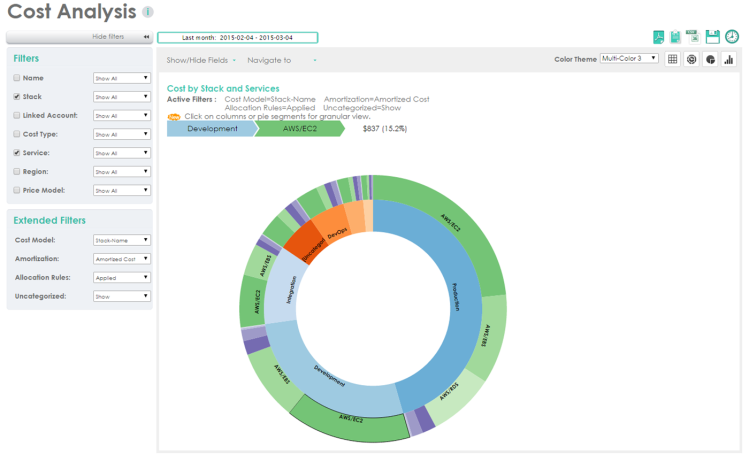
This report provides a granular view of IT cost allocation within an organization, by allowing CFOs to configure profiles according to cost allocated segments. Reports can be filtered by departments, projects, cost centers, or a combination of these components. As you can see in the screenshot below, this report displays a cost analysis chart. The inner circle shows cost allocation between departments or development stages highlighting cloud costs for each of these departments. Hover over one of the parts in the chart to view the costs of a specific object within the cloud. For example, by hovering over Development, one can see exactly which portion of costs are spent on Amazon Web Services’ (AWS) EC2 cloud infrastructure service.

2. Monthly and annual projected costs
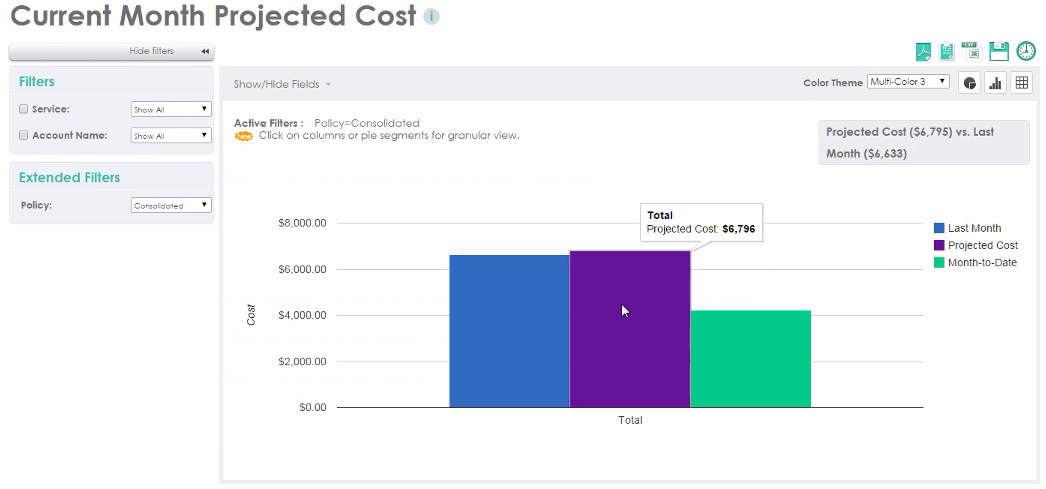
CFOs need to report the previous year’s cloud ROI, as well as forecast, plan, and enforce the next year’s budget. In the graph below, the bar on the left indicates last month’s spend, the bar on the right indicates the current month’s spend-to-date, and the middle bar shows the projected cost for the current month according to last month’s spend and this month’s spend-to-date data.
3. Porting recommendations
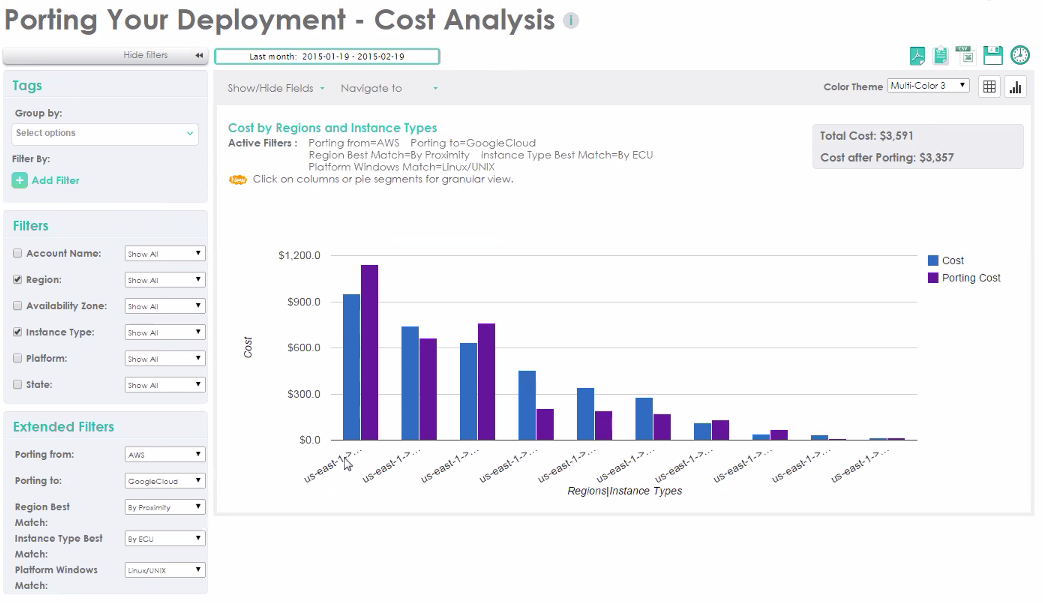
This report can be used to leverage arbitrage opportunities between clouds, so one can check if it’s worthwhile to move assets to another vendor, assuming that application portability between clouds is relevant and feasible. The chart below displays a cost comparison for moving between the Google and Amazon clouds. In this example, the overall cost of porting resources to Amazon would be higher, but individual resources that cost less can be moved so that the best possible offer for each cloud asset can be selected. After making a selection, the report can be sent to one’s chief information officer (CIO) to look into potential opportunities and take further action.
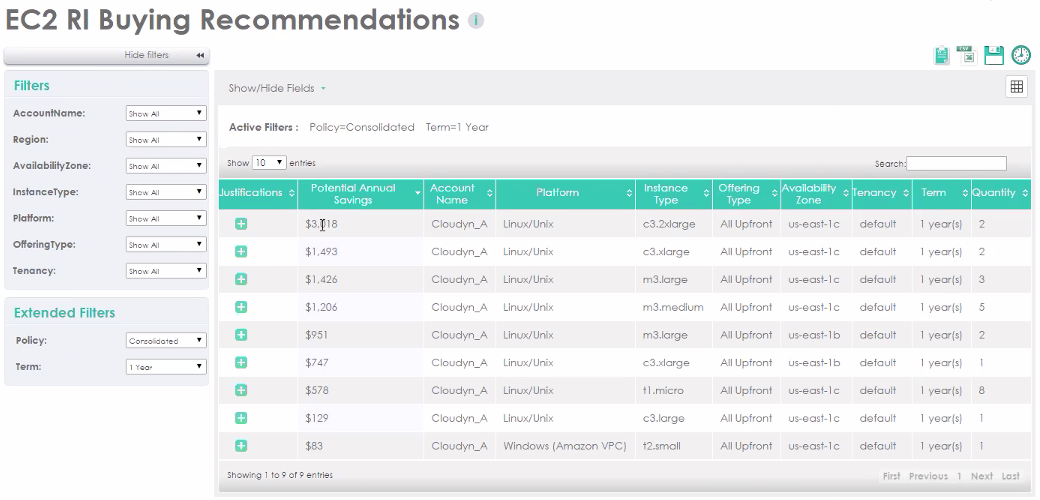
4. Compute distribution, including reserved-instance recommendations
This report shows compute distribution over time between on-demand and Amazon’s Reserved Instances (RI), which feature RI recommendation reports. CFOs can use this graph to see if there are on-demand resources that are constantly in use. For example, the chart below demonstrates that around 40 instances are regularly used, while others fluctuate.
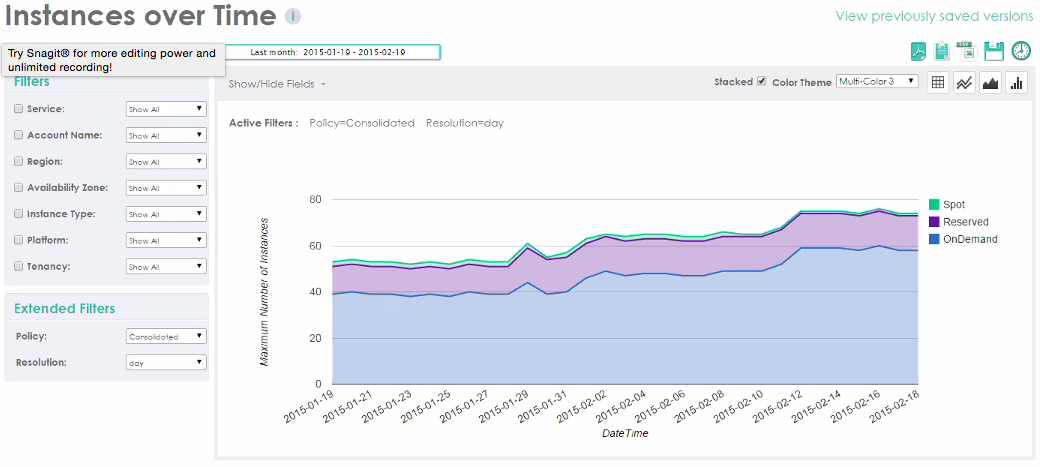
CFO teams need to recommend RI purchases based on their organization’s potential annual savings and can continuously optimize cloud asset purchases.
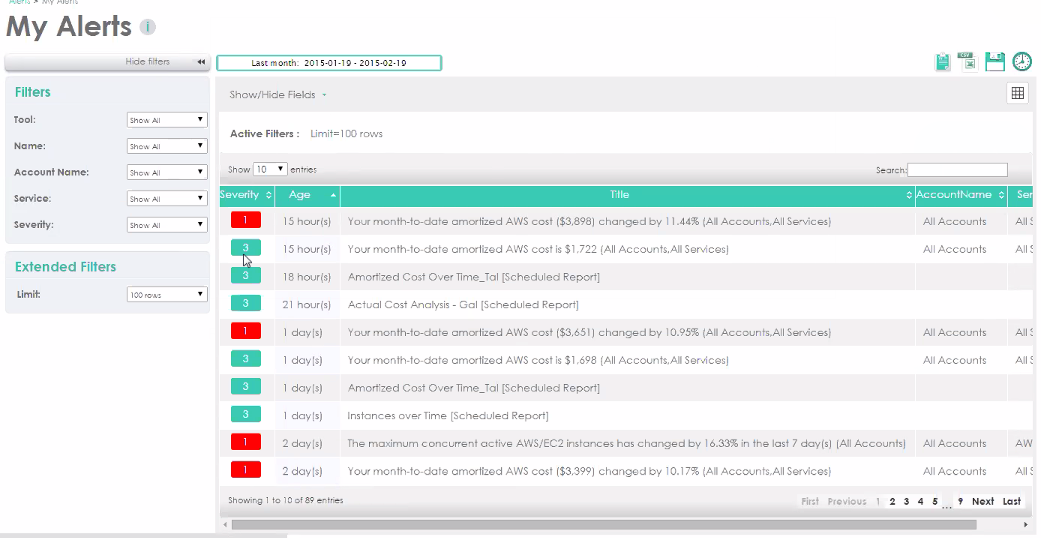
5. Month-to-date cost vs. threshold
This is a month-to-date cost alert that can be accompanied by a detailed report, providing valuable information about cost anomalies. This alert should be configured so that it’s received on a daily or weekly basis if month-to-date costs exceed a certain sum. Alert history also needs to be tracked in order to find recurring anomalies or other patterns.
Looking at the first alert in the screenshot below, one can see that AWS’ month-to-date cost changed by 11.44 percent relative to the previous period. Since a threshold of 10 percent was previously set in Cloudyn’s Alert Management feature, a red alert was sent after it was exceeded. After seeing this detected anomaly, a CFO team could pass this information on to the CIO’s office to analyze and report why the spike occurred.
Final notes
CFO teams need to be aware of all financial aspects of their organization’s IT consumption in order to optimize costs, encourage IT to reduce financial risks, and avoid cloud sprawl. The reports above provide insightful and flexible offerings, such as filtering and single resource drill-downs. Organizations can benefit from these reports to become more aware of and better control their finances.
Yoav Mor is product marketing manager at cloud cost management startup Cloudyn.