The past two years have seen a marked rebound in the number of venture-backed technology companies that are going public. After the depths of the “great recession” in 2009, it’s quite a relief for venture capitalists and those who invest in their funds.
It hasn’t all been smooth sailing, however.
Over the 2010-2011 period, the IPO “window” has opened and closed several times due to market volatility. That’s the result of various economic and political aftershocks from the financial crisis.
While there have been many articles about how the venture capital firm investors fared, or the employees of the companies going public or even the investment bankers, VentureDeal has taken a look to see how venture-backed stocks have performed after the IPO date.
Why should you care? Institutional buyers of IPO stock drive the IPO market demand for technology companies. Demand for IPOs and the resultant valuations drive tech industry M&A valuations and to some extent financing valuations. These two exit paths determine financial returns for venture capital firms and their ultimate ability to raise new money to fund the creation and commercialization of the next world changing technologies. Post-IPO performance is the “top of the food chain” and if it isn’t working well, the food chain breaks down. As Kevin Efrusy of Accel Partners recently said, “There is still strong institutional memory of the dot-com bubble and broken trust.”
Unfortunately, post-IPO stock performance of venture-backed technology companies over the past two years in the aggregate has been poor, when compared to the standard benchmark of the S&P 500 Index.
The spreadsheet below tracks the 80 VC-backed technology companies that went public between January 1, 2010 and December 31, 2011 and compares that to a baseline return for the S&P 500 during the same period. (We gave a 30 day grace period for the last IPO, which happened on December 15, 2011, so the actual end date was 1/15/2012.)
(You can also view this spreadsheet on Google Docs or Box.)
The data shows that the combined return for all offerings in the aggregate was a dismal -2.2 percent, compared to the S&P 500 index, which returned 15.5 percent for the same period.
Of the total of 80 IPOs, just 26 companies beat the S&P 500.
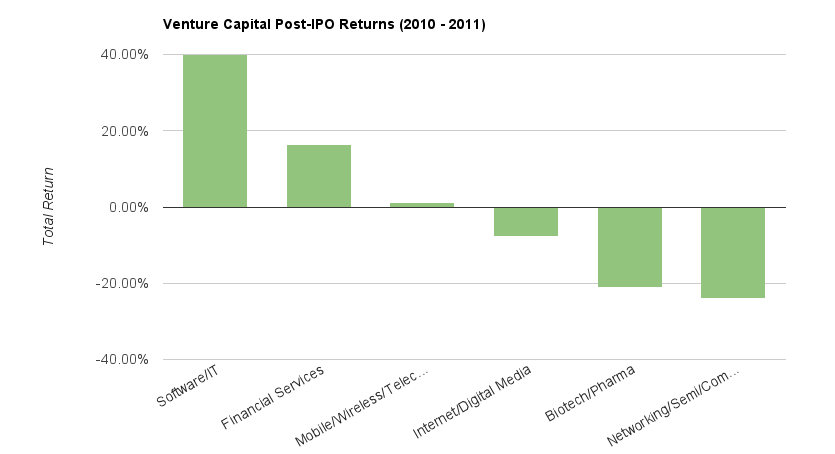
The chart above breaks down the returns to illustrate performance by industry. The Software/IT industry grouping performed the best with a 39.9 percent aggregate return over the 2010-2011 period. The Financial Services sector came in a distant second at 16.3 percent and the Mobile/Wireless/Telecom industry grouping rounded out the positive performers (barely) with a 1.2 percent total return.
Notably, the industry grouping of Internet/Digital Media has produced a -7.7 percent return.
So, with a -2.2 percent aggregate return for all venture backed technology IPOs over the last two years when compared to the S&P 500 benchmark, perhaps someone can tell me why some are advocating that we need more IPOs?
Perhaps SecondMarket CEO Barry Silbert is right when he said recently, “The IPO market is dying.”
Or, as Vivek Wadhwa recently argued, if you’re holding out for an IPO boom, you’re going to be disappointed.
VentureTrends is a research service of VentureDeal, a national venture capital database based in Menlo Park, Calif.


