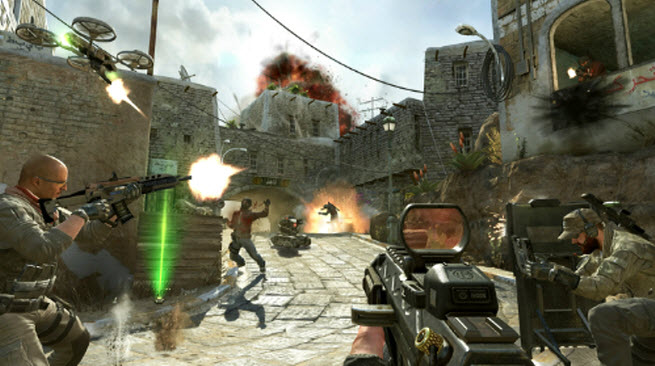
Call of Duty: Black Ops II beat out Halo 4 for the top spot for U.S. retail game unit sales during the critical month of November, according to market researcher NPD.
[aditude-amp id="flyingcarpet" targeting='{"env":"staging","page_type":"article","post_id":585848,"post_type":"story","post_chan":"none","tags":null,"ai":false,"category":"none","all_categories":"games,","session":"C"}']But both blockbuster games were not able to lift overall game sales high enough to beat sales for November 2011. Sales for total video game hardware, software, and accessories sold at retail were $2.55 billion in November, down 11 percent from $2.87 billion a year ago.
The list does not include some of the fastest-growing parts of the game business, which includes used-game sales, mobile games, social games, and online titles such as free-to-play games. But the U.S. retail sales list is still useful in pointing out trends in gamer tastes, and it also keeps score on which companies are performing the best.
Game hardware sales were $838.9 million, down 13 percent from $962.2 million a year ago. Game software sales were $1.43 billion, down 11 percent from $1.60 billion a year ago. Game accessory sales were $280.9 million, down 8 percent from $305.3 million a year ago. If you count PC games, total software sales were $1.46 billion, down 11 percent from $1.65 billion a year ago.
It’s no surprise that Black Ops II beat out Halo 4, as Black Ops II is on more platforms.
The top 10 games of the month were:
- Call of Duty: Black Ops II (360, PS3, Wii U, PC)** 1 Activision Blizzard
- Halo 4 (360)** 2 Microsoft
- Assassin’s Creed III (360, PS3, Wii U, PC)** 3 Ubisoft
- Just Dance 4 (Wii, 360, Wii U, PS3) 4 Ubisoft
- Madden NFL 13 (360, PS3, Wii, PSV, Wii U) 5 Electronic Arts
- Skylander Giants (Wii, 360, PS3, 3DS, Wii U)** 6 Activision Blizzard
- Need for Speed: Most Wanted 2012 (PS3, 360, PSV, PC) 7 Electronic Arts
- NBA 2K13 (360, PS3, Wii, PSP, Wii U, PC)** 8 Take 2 Interactive
- WWE 13 (360, PS3, Wii) 9 THQ
- FIFA Soccer 13 (360, PS3, Wii, PSV, 3DS, Wii U, PSP) 10 Electronic Arts
**(includes CE, GOTY editions, bundles, etc., but not those bundled with hardware)
Here’s the analysis from Liam Callahan, analyst at NPD:
Overall
[aditude-amp id="medium1" targeting='{"env":"staging","page_type":"article","post_id":585848,"post_type":"story","post_chan":"none","tags":null,"ai":false,"category":"none","all_categories":"games,","session":"C"}']
“These sales figures represent new physical retail sales of hardware, software and accessories, which account for roughly 50 percent of the total consumer spend on games. When you consider our preliminary estimate for other physical format sales in November such as used and rentals at $207 million, and our estimate for digital format sales including full game and add-on content downloads including microtransactions, subscriptions, mobile apps and the consumer spend on social network games at $410 million, we would estimate the total consumer spend in November to be over $3.1 billion. Our final assessment of the consumer spend in these areas outside of new physical retail sales will be reported in February in our Q4 Games Market Dynamics: U.S. report.”
“It’s important to compare this month’s results to November 2005, which was the last time the industry began to transition between console generations with the launch of a new platform. Comparing this month’s results to November 2005, retail video games sales are nearly twice as big as they were then (+97%). This really demonstrates the long-term health of retail sales even as many platforms are quite late in their lifecycles.”
“Despite an overall retail video game decline of 11 percent, November had the smallest year-over-year decrease we have seen for dollar and unit sales so far this year. This is a sign of momentum going into the December holiday period.”
Software
[aditude-amp id="medium2" targeting='{"env":"staging","page_type":"article","post_id":585848,"post_type":"story","post_chan":"none","tags":null,"ai":false,"category":"none","all_categories":"games,","session":"C"}']
“At 14 percent, video game software unit declines are tied with August 2012 for the smallest year-over-year declines so far this year.”
“Overall entertainment software units decreased by 15 percent, however, when comparing the performance of the top 5 titles from this year to last, we see a rise in unit sales of 5 percent (games outside of the top 5 sold less, leading to overall declines).”
“While there was a 21 percent decline in the number of titles that launched this November versus November 2011, these new titles are holding their own and generating the same number of dollars per title on average. Unfortunately, declines this month stemmed from softer sales from catalog titles, which launched outside of this month, with dollar sales down 11 percent, collectively.”
“Half of the software dollars sold in November 2012 were for the Xbox 360, which gained 8 share points in overall software sales from last November.”
[aditude-amp id="medium3" targeting='{"env":"staging","page_type":"article","post_id":585848,"post_type":"story","post_chan":"none","tags":null,"ai":false,"category":"none","all_categories":"games,","session":"C"}']
Hardware
“November 2012 was the lowest hardware decline for dollar sales we have seen in year-over-year trends so far this year.”
“The much anticipated launch of the new Wii U console brought in more dollars than the Wii launch in November 2006, up 21 percent from that launch month. With an average price 35 percent higher for the Wii U at launch compared to the Wii, this is an example of how consumers are willing to come out and spend when they see the value of the product.”
“Comparing Wii sales from November 2011 to Wii sales combined with Wii U sales in November 2012, dollar sales increased by 76 percent.”
[aditude-amp id="medium4" targeting='{"env":"staging","page_type":"article","post_id":585848,"post_type":"story","post_chan":"none","tags":null,"ai":false,"category":"none","all_categories":"games,","session":"C"}']
“Xbox 360 led overall hardware platform sales for the sixteenth consecutive month.”
“Through bundling compelling third party content with the PS Vita hardware, November 2012 was the second highest month of sales on a unit basis for the PS Vita since launch.”
“The Nintendo DS was the only platform to increase in hardware unit sales versus November 2011.”
Accessories
[aditude-amp id="medium5" targeting='{"env":"staging","page_type":"article","post_id":585848,"post_type":"story","post_chan":"none","tags":null,"ai":false,"category":"none","all_categories":"games,","session":"C"}']
“Skylanders accessories continue to perform well, building off the original game with the Skylanders Giants. Skylanders unit sales of both original and the new Giants were up over 250 percent compared to last November.”

