

Welp, it’s that time of the year again: CES, when tech manufacturers bombard us with shiny toys, gee-whiz stats, and every possible mechanism to shock, awe, and delight.
As the show kicks off, the data nerds at Nielsen would like to offer for your consideration this fascinating organization of a ton of gadget facts.
Want the truth about second- and third-screen usage? It’s all there. Smartphone market share? Ditto. The rate of decline for traditional broadcast TV reception? Check out the infographic, son:
AI Weekly
The must-read newsletter for AI and Big Data industry written by Khari Johnson, Kyle Wiggers, and Seth Colaner.
Included with VentureBeat Insider and VentureBeat VIP memberships.
Click to see larger version.
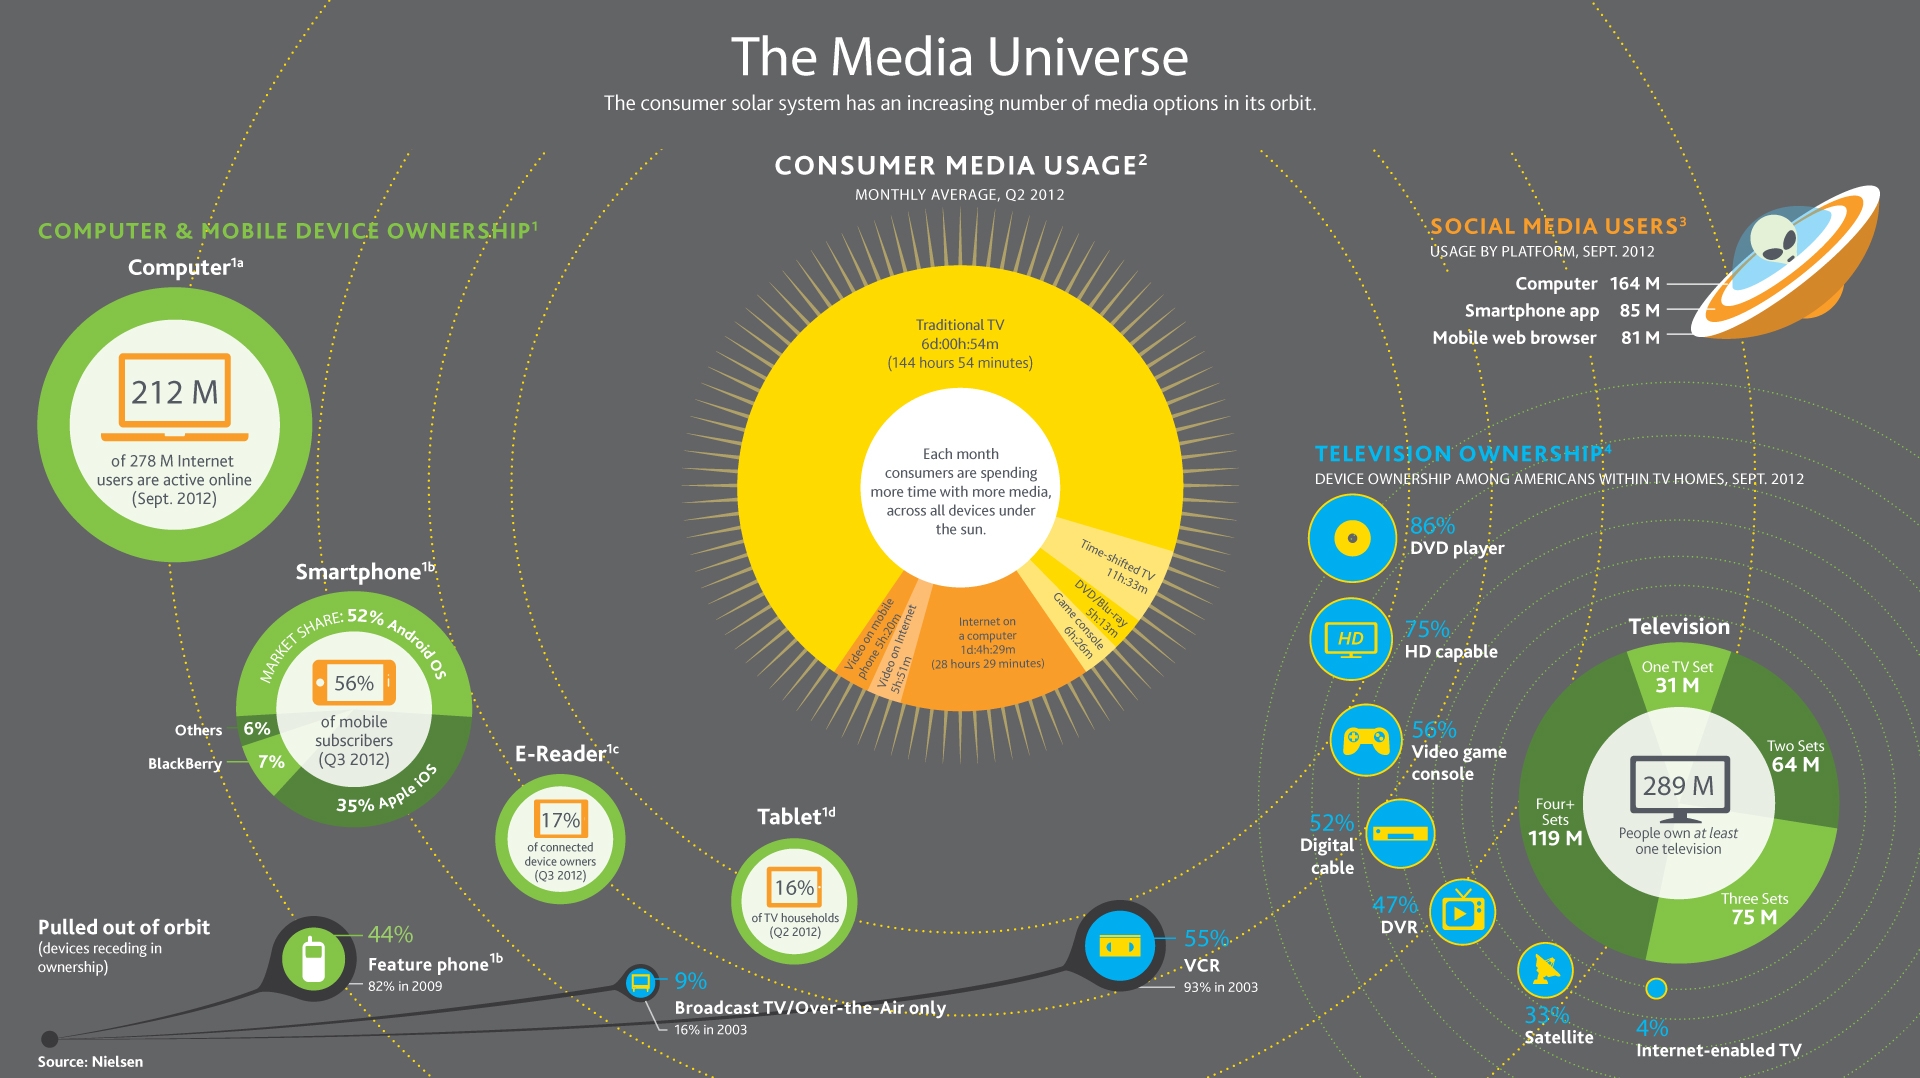
According to the Neilsen blog post on the data viz of the day, all the info in the graphic comes from the firm’s Consumer Usage Report for United States gadget owners and Internet users in 2012.
VentureBeat's mission is to be a digital town square for technical decision-makers to gain knowledge about transformative enterprise technology and transact. Learn More