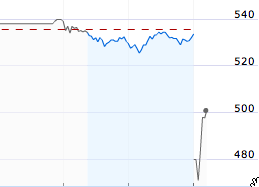
 “Strong international growth as well as sustained traffic increases on Google’s web properties propelled us to another strong quarter, despite a more challenging economic environment,” said Eric Schmidt, CEO of Google referring to the company’s second quarter results. Wall Street does not agree. Google’s stock price is plummeting as I write this while listening in to Google’s second quarter earnings call.
Immediately after the results were released, Google’s stock went from just over $530-a-share all the way down to near $470-a-share in after-hours trading. It’s rebounding a bit right now, but remains below the $500-a-share level. Google’s stock has not been below that mark since April, right before Google’s first quarter earnings announcement.
 Google had a strong first quarter beating Wall Street estimates and thus its shares shot through the roof. The second quarter has been a different story.
Google reported a profit of $4.63-per-share in the second quarter (excluding stock-based compensation costs). This was below Wall Street forecasts which were looking for something closer to $4.72-per-share.
Other things of note from the call included:
- In terms of its ad business, Schmidt called Google’s search advertising deal with Yahoo, its “signature event.” He noted that the non-exclusive part of the deal was one of the key points. This is no doubt aimed at the government, which is worried about Google gaining a search monopoly with such a deal.
- Schmidt also noted that Yahoo and Google remain “fierce competitors” and said that Google’s position is that it’s important for Yahoo to remain independent (read: not get bought by Microsoft) to maintain competition on the Internet.
- There was a lot of talk about the recent Lions Gate deal with YouTube. Google seems very excited about the possibility of teaming up with the movie studio to allow for its content to legally be placed on the video sharing site. Google will be sharing advertising revenue made off of the clips with Lions Gate.
- For Google’s Android mobile platform, Google reiterated that it expects to see the first phones with Android by the end of this year. It also noted that there are now 34 companies in its Open Handset Alliance (OHA), committed to the Android platform.
Some key financial points from the release:
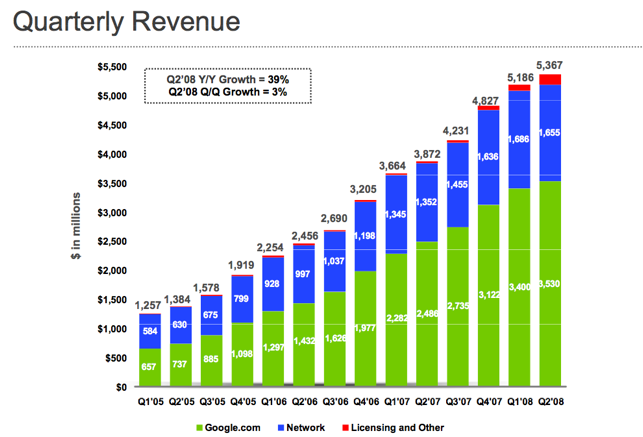
Revenues – Google reported revenues of $5.37 billion for the quarter ended June 30, 2008, representing a 39% increase over second quarter 2007 revenues of $3.87 billion and a 3% increase over first quarter 2008 revenues of $5.19 billion. Google reports its revenues, consistent with GAAP, on a gross basis without deducting TAC.
Google Sites Revenues – Google-owned sites generated revenues of $3.53 billion, or 66% of total revenues, in the second quarter of 2008. This represents a 42% increase over second quarter 2007 revenues of $2.49 billion and a 4% increase over first quarter 2008 revenues of $3.40 billion.
Google Network Revenues – Google’s partner sites generated revenues, through AdSense programs, of $1.66 billion, or 31% of total revenues, in the second quarter of 2008. This represents a 22% increase over network revenues of $1.35 billion generated in the second quarter of 2007 and a 2% decrease over first quarter 2008 revenues of $1.69 billion.
International Revenues – Revenues from outside of the United States totaled $2.80 billion, representing 52% of total revenues in the second quarter of 2008, compared to 48% in the second quarter of 2007 and 51% in the first quarter of 2008. Had foreign exchange rates remained constant from the first quarter of 2008 through the second quarter of 2008, our revenues in the second quarter of 2008 would have been $88 million lower. Had foreign exchange rates remained constant from the second quarter of 2007 through the second quarter of 2008, our revenues in the second quarter of 2008 would have been $249 million lower.
Revenues from the United Kingdom totaled $774 million, representing 14% of revenue in the second quarter of 2008, compared to 15% in the second quarter of 2007 and 15% in the first quarter of 2008.
Paid Clicks – Aggregate paid clicks, which include clicks related to ads served on Google sites and the sites of our AdSense partners, increased approximately 19% over the second quarter of 2007 and decreased approximately 1% over the first quarter of 2008.
TAC – Traffic Acquisition Costs, the portion of revenues shared with Google’s partners, decreased to $1.47 billion in the second quarter of 2008. This compares to TAC of $1.49 billion in the first quarter of 2008. TAC as a percentage of advertising revenues was 28% in the second quarter, compared to 29% in the first quarter of 2008.
The majority of TAC expense is related to amounts ultimately paid to our AdSense partners, which totaled $1.32 billion in the second quarter of 2008. TAC is also related to amounts ultimately paid to certain distribution partners and others who direct traffic to our website, which totaled $154 million in the second quarter of 2008.
Other Cost of Revenues – Other cost of revenues, which is comprised primarily of data center operational expenses, amortization of intangible assets, credit card processing charges as well as content acquisition costs, increased to $674 million, or 13% of revenues, in the second quarter of 2008, compared to $624 million, or 12% of revenues, in the first quarter of 2008.
Operating Expenses – Operating expenses, other than cost of revenues, were $1.64 billion in the second quarter of 2008, or 31% of revenues, compared to $1.53 billion in the first quarter of 2008, or 29% of revenues. The operating expenses in the second quarter of 2008 included $810 million in payroll-related and facilities expenses, compared to $809 million in the first quarter of 2008.
Stock-Based Compensation (SBC) – In the second quarter of 2008, the total charge related to SBC was $273 million as compared to $281 million in the first quarter of 2008.
We currently estimate stock-based compensation charges for grants to employees prior to July 1, 2008 to be approximately $1.1 billion for 2008. This does not include expenses to be recognized related to employee stock awards that are granted after July 1, 2008 or non-employee stock awards that have been or may be granted. We currently anticipate that dilution related to all equity grants to employees will be at or below 2% this year.
Operating Income – GAAP operating income in the second quarter of 2008 was $1.58 billion, or 29% of revenues. This compares to GAAP operating income of $1.55 billion, or 30% of revenues, in the first quarter of 2008. Non-GAAP operating income in the second quarter of 2008 was $1.85 billion, or 34% of revenues. This compares to non-GAAP operating income of $1.83 billion, or 35% of revenues, in the first quarter of 2008.
Interest Income and Other, Net – Interest income and other was $58 million in the second quarter of 2008, compared with $167 million in the first quarter of 2008. The decrease was primarily related to lower yields on our cash balances, as well as lower average cash balances as a result of cash used in the first quarter to acquire DoubleClick; lower net realized gains on the sale of our marketable securities; and an increase in expenses as a result of more activity under our foreign exchange risk management program.
Net Income – GAAP net income for the second quarter of 2008 was $1.25 billion as compared to $1.31 billion in the first quarter of 2008. Non-GAAP net income was $1.47 billion in the second quarter of 2008, compared to $1.54 billion in the first quarter of 2008. GAAP EPS for the second quarter of 2008 was $3.92 on 318 million diluted shares outstanding, compared to $4.12 for the first quarter of 2008, on 317 million diluted shares outstanding. Non-GAAP EPS for the second quarter of 2008 was $4.63, compared to $4.84 in the first quarter of 2008.
Income Taxes – Our effective tax rate was 24% for the second quarter of 2008.
Cash Flow and Capital Expenditures – Net cash provided by operating activities for the second quarter of 2008 totaled $1.77 billion as compared to $1.78 billion for the first quarter of 2008. In the second quarter of 2008, capital expenditures were $698 million, the majority of which was related to IT infrastructure investments, including data centers, servers, and networking equipment. Free cash flow, an alternative non-GAAP measure of liquidity, is defined as net cash provided by operating activities less capital expenditures. In the second quarter of 2008, free cash flow was $1.07 billion.
We expect to continue to make significant capital expenditures.
A reconciliation of free cash flow to net cash provided by operating activities, the GAAP measure of liquidity, is included at the end of this release.
Cash – As of June 30, 2008, cash, cash equivalents, and marketable securities were $12.7 billion.
On a worldwide basis, Google employed 19,604 full-time employees as of June 30, 2008, up from 19,156 full-time employees as of March 31, 2008.
[Photo: flickr/Mykl Roventine]


